Download
1 / 100
1k likes | 1.04k Vues
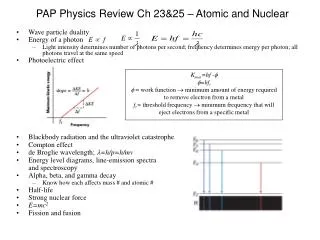
This power point is the summer assignment for PAP Physics. Please show all work on practice “Do and Turn In” problems and be prepared to both submit the completed work and take a quiz after returning to school in the fall. You CANNOT be in PAP Physics unless you are concurrently enrolled in Alg 2.

E N D
This power point is the summer assignment for PAP Physics. Please show all work on practice “Do and Turn In” problems and be prepared to both submit the completed work and take a quiz after returning to school in the fall. You CANNOT be in PAP Physics unless you are concurrently enrolled in Alg 2. PAP Physics Mr. Robert Powell RPOWELL@huffmanisd.net
Physics and Math • Physics is the study of motion, forces, matter, energy and their interactions. • Physics and math are interconnected. Theories in physics are almost always explained using math models or equations. • Since math is used to solve most physics problems, math is sometimes called the language of physics. • Because math is such an integral part of physics, some basic math skills are important to learn and completely understand.
Math Skills • Necessary math skills are: • Measurements – both English and Metric • Graphing • Scientific Notation • Exponents and powers • Adding, subtracting, multiplying and dividing • Geometry • Length, area, and volume • Parallelograms and other geometric shapes • Circles – radius, diameter, circumference, and angles • Algebra • Conversions • Vector math
Physics Symbols • In most math classes, the variables are represented by x’s and y’s. • Physics has symbols also, but instead of x’s and y’s, the symbols will be letters of both the English and Greek alphabet. • Write down and MEMORIZE the following table of basic symbols:
Basic Measurements • Measurements will be in both metric (SI) and English units. • Write down and MEMORIZE the following table of basic units.
Rulers • You will be required to make measurements with both an English (inch) ruler and a metric (centimeter) ruler. • It is important to know how to read a ruler accurately.
End of ruler First mark inch marks English Rulers • English rulers measure in inches. The inches are subdivided in 16 parts. • Make sure that you measure beginning with the first mark, not the end of the ruler. 1/16 inch marks 1/4 inch marks 1/2 inch marks 1/8 inch marks
English Rulers How long is the line below according to the ruler? 3 15/16 inches
End of ruler First mark cm marks Metric Rulers • Metric rulers measure in centimeters. The centimeters are subdivided in 10 parts (millimeters). • Make sure that you measure beginning with the first mark, not the end of the ruler. mm marks
Metric Rulers How long is the line below according to the ruler? 9.6 cm or 96 mm
Graphing • Graphs are useful for showing trends and predicting outcomes. • Graphs are a visual representation of the data. • There are many types of graphs, but the most common are: • Bar graphs • Circle or Pie graphs • Line graphs
Types of Graphs • Bar Graphs • Used for grouping data • Used to show trends • Circle or Pie Graphs • Used for displaying percentages • Line Graphs • Used to show trends • Independent/Dependent Variables (cause and effect)
Parts of a Line Graph • Line graphs include: • A title • An x-axis with • labels, including units • a data value range • A y-axis with • labels, including units • a data value range • A grid with data points plotted • A line connecting the data points (usually). • The line graph is derived from data pairs (x,y). • The x-axis is the independent variable (if time is a variable, it is always on the x-axis). • The y-axis is the dependent variable. Remember DRY MIX
Independent and Dependent Variables • Anindependent variable is the variable that is controlled by the experimenter and is unaffected by other variables – i.e. the cause • A dependent variable is dependent on and controlled by the independent variable; it will change when the independent variable changes – i.e. the effect
Independent and Dependent Variables • Anindependent variable is the variable that is controlled by the experimenter and is unaffected by other variables – i.e. the cause • A dependent variable is dependent on and controlled by the independent variable; it will change when the independent variable changes – i.e. the effect
y-axis } rise y rise run x } run x-axis Slope • The slope of a graph is the ratio of the vertical (rise) and horizontal (run) distances between two points on a line. • The slope is zero if the line is horizontal. • The slope is undefined if the line is vertical Slope = =
Analyzing Graphs Without Numbers Recall the old fairy tale of the three little pigs. Track the position of the wolf as he goes to each pig’s house. Since his position will be dependent on time, make position the y-axis and time the x-axis. • The wolf travels from his house to the first pig’s straw house. Since his position is changing, the graph will have a slope. • At the straw house, he blows it down. While he is blowing the house down, his position is constant (not changing), so the graph will have a slope of zero. • Once he has blown down the straw house, he must travel to the stick house. Since his position is changing, the graph will have a slope. • At the stick house, his position is constant as he blows the house down. The graph’s slope is zero. • Once he has blown down the stick house, he must travel to the brick house. The graph shows a slope. • While huffing and puffing at the brick house, his position is constant so the slope is zero. position time
Position vs. Time Graph • The graph of the wolf traveling from house to house is a position vs. time graph. • Where there is a slope, the wolf is moving. • When the wolf is moving, he has speed. • Speed is calculated by dividing the change is position (distance) by time. • So the slope of a position vs. time graph is speed. A zero slope indicates a speed of zero - no movement. position time
Speed vs. Time Graph • Since the slope of a position vs. time graph is speed, we can extrapolate a speed vs. time graph. • Remember that a constant position on the position vs. time graph has a slope of zero. • Similarly, a constant speed on a speed vs. time graph will have a slope of zero. • Where there is a slope on the position vs. time graph, the wolf has a constant speed. The corresponding slope of the speed vs. time graph will be zero, but will be located up on the y-axis as his constant speed is non-zero. • When the wolf is not moving, he has a constant speed of zero. The corresponding slope of the speed vs. time graph is zero, located on the x-axis to show zero speed. position time speed time
Analyzing Graphs With Numbers position vs. time 20 • Speed can be calculated from a position vs. time graph. • Since the equation for speed is distance divided by time, speed is the slope of a position vs. time graph. • By finding the slope of the position vs. time graph shown, we see that the speed is 5 m/s. • Since the slope is constant, so is the speed. This means that the slope of a speed vs. time graph will be zero and will be located at 5 m/s on the y-axis. 15 y x 10 m 2 s = position (m) 10 5 = 5 m/s 1 2 3 time (s) speed vs. time 10 speed (m/s) 5 2 3 1 time (s)
Example position vs. time speed vs. time 20 20 15 15 Both of these graphs show the exact same information position (m) 10 10 speed (m/s) 5 5 1 2 3 2 3 1 time (s) time (s) y x 10 m 2 s = = 5 m/s zero slope = zero speed y x 10 m 1 s = = 10 m/s
Analyzing Graphs With Numbers position vs. time 20 • Speed can be calculated from a position vs. time graph. • Since the equation for speed is distance divided by time, speed is the slope of a position vs. time graph. • By finding the slope of the position vs. time graph shown, we see that the speed is 5 m/s. • Since the slope is constant, so is the speed. This means that the slope of a speed vs. time graph will be zero and will be located at 5 m/s on the y-axis. 15 y x 10 m 2 s = position (m) 10 5 = 5 m/s 1 2 3 time (s) speed vs. time 10 speed (m/s) 5 2 3 1 time (s)
Analyzing Graphs With Numbers position vs. time 20 • Speed can be calculated from a position vs. time graph. • Since the equation for speed is distance divided by time, speed is the slope of a position vs. time graph. • By finding the slope of the position vs. time graph shown, we see that the speed is 5 m/s. • Since the slope is constant, so is the speed. This means that the slope of a speed vs. time graph will be zero and will be located at 5 m/s on the y-axis. CHECK QUESTION: What would a positive slope on a speed vs. time graph indicate? 15 y x 10 m 2 s = position (m) 10 5 = 5 m/s 1 2 3 It would indicate that speed is increasing. So the slope of a speed vs. time graph will give acceleration! time (s) speed vs. time 10 speed (m/s) 5 2 3 1 time (s)
Additional Hints • Hints: • Velocity (speed) = change in position (distance) ÷ time • Acceleration = change in velocity (speed) ÷ time • Remember that a zero slope indicates a constant value. • A positive slope will give a positive value. • A negative slope will give a negative value.
prefix exponent or power } 3.14 x 10⁸ decimal point base number 10 Scientific Notation • Scientific notation is useful when dealing with very large or very small numbers. • It makes use of powers of 10. • Scientific notation involves a prefix, a decimal point, the number 10, and a number called an exponent or power. • Each of the numbers in the prefix is referred to as a digit.
Examples • Look at the examples below. Clearly, scientific notation makes it easier to work with large and small numbers. • 1,000,000,000,000,000 = 1 x 10¹⁵ • 0.000 000 000 000 250 = 2.50 x 10⁻¹³
Powers of Ten – Positive Exponents • 100 = 1 • 101 = 10 • 102 = 10 x 10 = 100 • 103 = 10 x 10 x 10 = 1000 • 104 = 10 x 10 x 10 x 10 = 10,000
Powers of Ten – Negative Exponents • 10-1 = 1/10 = 0.1 • 10-2 = 1/100 = 0.01 • 10-3 = 1/1000 = 0.001 • 10-4 = 1/10000 = 0.0001
Scientific Notation – Large Numbers • Count the decimal places from right to left until there is just one whole number to the left of the decimal point. • 3,500 = 3.5 x 10³ • 7,326,000. = 7.326000 x 10⁶ • 280,000 = ? • 36,000 = ? The decimal point means that you keep all the zeros. . 2.8 x 10⁵ No decimal point means that you drop all the zeros. 3.6 x 10⁴
Scientific Notation – Small Numbers • Count places to the right until there is one number to the left of the decimal point • 0.000 060 = 6.0 x 10⁻⁵ • 0.000 45 = 4.5 x 10⁻⁴ • 0.003 = ? • 0.000 0025 = ? 3 x 10⁻³ 2.5 x 10⁻⁶
Multiplying with Scientific Notation • Adding the exponents • 102 x 103 = 105 is the same as: • 100 x 1,000 = 100,000
Multiplying with Scientific Notation Example: Multiply (2.5 x 102) x (3.5 x 103) • Multiply the prefixes • 2.5 x 3.5 = 8.75 • Add the exponents • 102 x 103 = 105 • Answer: 8.75 x 10⁵
Dividing with Scientific Notation • Subtract the exponents 104 103 is the same as: 10,000 1,000 = 101 = 101
Dividing with Scientific Notation Example: Divide (3.75 x 10⁶) / (1.5 x 10²) • Divide the prefixes • 3.75 / 1.5 = 2.5 • Subtract the exponents • 106 / 102 = 104 • The final answer is 2.5 x 10⁴
Adding and Subtracting with Scientific Notation Example: (3.2 x 10²) + (1.5 x 10⁵) • Adjust the prefix to make the exponents match (0.0032 x 10⁵) + (1.5 x 10⁵) • Add or subtract the prefixes 0.0032 + 1.5 = 1.5032 • Include the power of 10 in the answer: 1.5032 x 10⁵
Adjusting Your Answer • After you add, subtract, multiply or divide, make sure that you final answer only has one digit to the left of the decimal point. • If the number to the left of the decimal is greater than one, move the decimal point to the left until there is only one digit to the left of the decimal point. Every time the decimal point is moved to the left, the exponent must increase by one (make the number smaller and make the exponent bigger). • If the number to the left of the decimal is zero, move the decimal to the right until there is one non-zero digit to the left of the decimal point. Every time the decimal point is moved to the right, the exponent must decrease by one (make the number bigger and make the exponent smaller).
Examples • (9 x 105) x (2 x 103) = 18 x 108 • Adjust your answer to 1.8 x 10⁹ • (2 x 10⁸) ÷ (8 x 10²) = 0.25 x 10⁶ • Adjust your answer to 2.5 x 10⁵ • (5 x 10⁴) + (8 x 10⁴) = 13 x 104 • Adjust your answer to 1.3 x 10⁵
Practice: Do and turn in 1. Convert to scientific notation: a) 2,357,000 b) 0.370 2. Multiply (2.75 x 108) x (3.5 x 104) 3. Divide (9.75 x 10¹²) ÷ (3.0 x 10³) 4. Add (5.5 x 10²) + (1.25 x 10⁴) 5. Subtract (6.5 x 10⁵) – (2.25 x 10³)
Geometry – Basic Shapes Some basic shapes are: Rectangles or squares Cubes Circles Spheres Cylinders Parallelograms
Geometry – Area Formulas • Area is a measure of a flat surface. • The area of a rectangle (or square) is: A=lxw where A = area in squared units (m2, in2, cm2, ft2, etc). l = length of the side of the rectangle w = width of one side of the rectangle • The area of a circle (or cross-sectional area of a cylinder) is: A=xr2or A=xd2 where A = area in squared units = 3.14159 r = the radius d = the diameter 4
Geometry – Volume Formulas • Volume is the space a body occupies. • The volume of a cube is: V=lxw xh or V=A xh, where A = lxw where V = volume in cubed units (m3, in3, cm3, ft3, etc). l = length of one side of the cube w = width of one side of the cube h = height of one side of the cube • The volume of a cylinder is: V=A xh where A = area of the base = xr2or A = xd2 h = height of the cylinder 4
Right Angle An angle whose measure is 90 Straight Angle An angle whose measure is 180 Acute Angle An angle whose measure is greater than 0 and less than 90 Obtuse Angle An angle whose measure is greater than 90 and less than 180 Reflex Angle An angle whose measure is greater than 180 and less than 360 Geometry - Angles • Drawing and measuring angles is a common part of many technical jobs. • Angles are measured as parts of a circle. There are 360 in a circle. • Two rays or two lines with a common endpoint (the vertex) form an angle. • Five types of angles:
Protractors • A protractor is a tool for measuring the size or number of degrees in any angle. • Line up the vertex with the hole in the bottom of the protractor and line up one ray with the zero line. • Read the degree where the other ray crosses over the protractor. • In this case the ray crosses over at 104; this is an obtuse angle of 104.
Degrees and Radians • There are 360 in a circle. • Another common unit of angle measure (particularly in circles) is radians. • There are 180 in radians and 360 in 2 radians. • Radians are useful when dealing with calculations involving revolutions. 2 radians = 1 complete revolution. • When working with radians, it is customary to work with fractions of .
Class Work • Using a protractor, cut out a full circle and label the circle as shown:
Algebra Review • Objectives: • Simplify an expression (order of operations). • Rearrange formulas so that one variable is isolated. • Substitute into formulas and solve for unknown quantities.
Formulas • Formulas, sometimes called equations, show how some quantities relate to each other. • Always take care to substitute correct numbers and units for known symbols in an equation. Answers will be in English or metric units, not both!
Order of Operations • Mathematical operations are: • Addition • Subtraction • Multiplication • Division • A numerical expression is a combination of numbers and operations, such as 130 ÷ 10 + 3 x 2. • An algebraic expression contains one or more variables, such as 2x2 – 5x + 3. • To evaluate an expression means to find its value. When evaluating an algebraic expression, the variable must be replaced with a value. • When evaluating any expression, the mathematical operations must be done in the following order: • Parentheses • Exponents • Multiplication and division – from left to right • Addition and subtraction – from left to right
Rearranging Formulas • Sometimes, a formula is given that has to be rearranged to isolate a certain variable. For example, the equation for the volume of a sphere is V = 4/3 r3 but the problem gives volume and asks for the value of the radius of the sphere. • Several mathematical steps will need to be taken to isolate r before any numbers may be plugged into the expression. • It is important to remember that whatever happens to one side of the equals sign MUST happen on the other side or the expression will no longer be equal or valid.
4 r3 V= 3 Rearranging Formulas • Look at the equation for the volume of a sphere again. • Notice that it is written so that it is very clear what is in the numerator and what is in the denominator. • This helps prevent confusion when rearranging the equation.