Download
1 / 61
650 likes | 984 Vues
The New Zealand Health and Disability System. Themes of Presentation. New Zealand population and international comparisons New Zealand’s health and disability support system and its performance Size of Vote Health and financing of health services Government's policy priorities

E N D
Themes of Presentation • New Zealand population and international comparisons • New Zealand’s health and disability support system and its performance • Size of Vote Health and financing of health services • Government's policy priorities • Future Directions
Key Factors • Small population (4.4m), in same land area as UK or Oregon • Ageing and diversifying population, with increasing burden of NCDs (chronic or longterm conditions) • Remote and rural areas a challenge for service provision • Fiscal constraint vs increased technology and expectations • Emphasis is on vertical and horizontal integration • Primary care teams and midwife-led maternity care • Backed by a small number of publicly reported targets to improve performance Our goal – a high quality and sustainable health sector which improves the health of New Zealanders
New Zealand Population • Total : 4.403 million • Most (3.3 million, 76%) live in North Island; and over half of New Zealanders (56%) live in 5 main centres • Ethnically diverse: • European proportion declining (68%) • Continuing relative increase in Asian (10% - and fastest growing), Pacific (7%) and Maori 14%
New Zealand Populationtotal: 4 403 000 1,355,000 3.3m 203,000 390,000 1.1m Estimated resident population at March 2011 City totals are for urban areas (Statistics NZ). 390,000 117,000
Projected Ethnic Population of New Zealand People identifying with more than one ethnicity have been included in each ethnic population. Source: Demographic Trends 2007, Statistics NZ
Life expectancy at birth, by gender,1950–52 to 2008–10 Source: Statistics NZ 2009; Demographic Trends 2007, Statistics NZ
Life Expectancy by ethnicity 1950-52 to 2000-02 Source: Statistics New Zealand 2004 Notes:
International comparison of life expectancy at birth, selected countries, 2009 or latest year Source: OECD Health Data 2011
We are living longer • From 1980-2009, life expectancy in NZ grew more than in Australia, UK, USA and Canada • NZ now has a similar life expectancy to these countries • In NZ in 2006, life expectancy at birth was 78.0 years for males and 82.2 years for females
We are living longer in full health • In 2006, health expectancy was 67.4 years for males, and 69.2 years for females • From 1996 to 2006, health expectancy increased by 2.7 years for males and females 1.7 years
Non-communicable diseases remain the leading cause of death in NZ • In 2008, the top 5 causes of death were cancer, ischaemic heart disease, stroke, chronic respiratory disease and other forms of heart disease • Combined, cardiovascular disease was the leading cause of death
The burden of NCDs • NCDs account for 50% of GP consultations, 70% of hospitalisations and 80% of deaths (2010) • Incidence rates of most NCDs, including CVD and cancer (but not diabetes) have decreased • Mortality rates for most NCDs, including CVD and cancer, have also decreased over the past decade • But absolute number of deaths continues to increase • One effect of mortality declining (and the population ageing) is an increasing prevalence of NCDs • Diabetes prevalence for adults was 6.9% in 2008/09 • Yet increase in prevalence may not translate into increase in burden • Depends on severity distribution and progression rate As we know, most NCDs are preventable
Risk factors for NCDs Obesity • More than 1 in 4 NZ adults are obese • Obesity prevalence increased from 1997 to 2008/09 • Men: 17% to 28%, women: 21% to 28% • Child obesity rate stable at about 9% in 2002 and 2006/07 Smoking • Rates have continued to decrease since 1980s, now 19% • Also decrease in youth rates (22% in 2006, 19% in 2009) Harmful use of alcohol • One in five drinkers (21%) had a hazardous drinking pattern in 2006/07, highest rate in 18-24-year-old men • There has been no change since 1996/97
Communicable diseases Rheumatic fever rates • Much higher in NZ than in other developed countries • Almost solely Māori and Pacific children affected Sexually transmitted infections (STIs) • High rates of chlamydia compared with other countries • 2-3 times greater in NZ than Australia, UK, US • Chlamydia and gonorrhea mainly affect young people
Other selected health issues Mental health • Highest rate of psychological distress is in women aged 15-24 years • NZ has one of highest rates of youth suicide in OECD Disability • One in ten NZers have a disability requiring assistance • People with intellectual disability have greater use of services, but poorer health outcomes Infant mortality rate • Rate has remained stable over past 10 years • However, internationally we do not compare well
Accelerating health improvement for all groups? • The report highlights areas where: • health outcomes for some groups (eg, Māori, Pacific) are significantly poorer than the average and contribute to declines or slow improvement in overall trends (eg, cancer mortality) • average outcomes are comparable to international benchmarks but are not at the same level for all population groups (eg communicable diseases) • Is the best response to focus on improving the health and wellbeing of those groups with poorer outcomes?
2011 key facts The health and disability system is complex and diverse. Every day tens of thousands of people interact within the system, as health professionals, service providers or members of the public. In the year to June 2011: • 62,660 people were born • 29,320 people died • 65.4 million prescription items were dispensed • 23.9 million laboratory tests were performed • there were approximately 13.8 million general practitioner visits • there were approximately 996,000 emergency department attendances • there were nearly 1 million in/day patient hospital discharges • there were 217,000 elective in/day patient admissions, of which 154,000 were for surgical elective services.
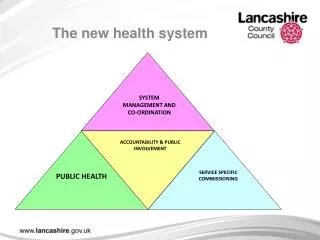
Structure of the New Zealand Health and Disability System
Health and disability system structure • Ministry of Health has overall responsibility for the management and development of the system • System leadership; Policy advice • Funder and regulator • Planner and purchaser of some national health services • 20 District Health Boards (DHBs) are responsible for the health of their population • 7 elected board members and 4 appointed by Minister • DHBs assess needs of their local populations • They plan, fund and provide services across the continuum of care (including primary care). They operate government-owned hospitals Vote: Health is $14.4 billion (projected for 2011/12) 75% ($10.8 billion) is devolved to DHBs).
Organisation Ministry of Health DHBs PHOs Vaccination Smoking Cessation Advice on behaviour change other primary care CD Outbreaks Environmental Health Hazardous Substances Food and Water Safety Health Promotion Surveillance PHUs NGOs CRIs Other Policy & Planning Provision
Key Features of New Zealand’s Health and Disability system • Primarily publicly funded • Universal access • Internationally comparable range of services • Needs-based • Fixed budgets • Prioritisation
How is the health system financed? • Government : Public funding of about 81% of health care costs; from taxation (86%), levies on employers (13%) and local government (1%) • Private insurance : 32% of NZers (1.38m) have private health insurance. This covers about 5% of total health care expenditures (2010). Used mainly for elective surgery in private hospitals. • Out of Pocket payments account for about 14% of total health care expenditure (2010) : patient co-payments for GP services, pharmaceuticals, private hospital/ specialist care, or adult dental care • Universal Coverage for accidents and injury Through “Crown Entity” ACC (Accident Compensation Corporation). • Primarily from levies on employers, employees and motor vehicle owners • General taxation funding for services for people who are not employed (children; unemployed; superannuitants)
Sources of FundingAggregate real ($ million 2009/10) health expenditure, 1995 -2010 Source: Ministry of Health
Publicly funded care • Government sets a global budget annually for most publicly funded health services • Hospital care (free to patient) • waiting times apply for non-urgent care • Maternity care (free) • Well child care 0 – 6yrs (free) • Dental services for children at school (free) • Subsidies for primary care • Subsidies for rest home care • Subsidies for pharmaceuticals ($3 co-payment) • Laboratory services (free if referred from public hospitals or GP)
The private sector: Funding and Provision • Private funding was 19% of total health spending in 2010/11 • Out of Pocket -14% • Insurance - 4.1% • Not-for-profit organisations – 0.9% • Areas of Private Provision • Private Hospitals • General Practitioners • Long Term Care • Home Care (support like bathing, dressing etc) • Private Specialists • Adult dental care • Non-Profit Organisations • disability support, mental health, palliative care
Investment in Health Spending is still growing …even in times of fiscal restraint NZ, and many countries, are asking - Is health funding affordable and sustainable?
1 2 3 4 • in addition to the $1.67b ACC spending on Health in 2009/10 (provisional figures), ACC paid a further $0.451b to the Crown for public health acute services and pharmaceuticals and lab tests for ACC claimants requiring these services (these amounts are already included in the DHB baseline figures)
1 2 3 4 International Comparison of Spending on Health, 1980–2010Source OECD Health Data 2011 Average spending on healthper capita ($US PPP) Total expenditures on healthas percent of GDP
Health spending per capita Source: OECD from draft 2011 Health at a Glance publication
Vote Health compared with other sectors Note the $14.4b Crown health expenses figure in the pie chart includes $0.752b Health payments to ACC The figures in the chart are forecasts for 2011/12 • Trends in Vote Health operating expenditure in the last decade: • in 2001/02 Vote Health was $6.49b, 17.3% of Core Crown Expenses, and 5.1% of GDP • by 2011/12 Vote Health is forecast to be $14.4b, 18.5% of Core Crown Expenses, and 6.5% of GDP
How well does the health and disability system perform?
How is system performance measured? • Ambulatory sensitive hospitalisations • Hospital readmissions • Amenable mortality and In-hospital mortality • Average length of stay • Patient experience • Efficiency and productivity • Health targets
ASH rates are increasing for Māori and Pacific • Between 2001 and 2010 the rate of ambulatory sensitive hospitalisations increased by 21% for Pacific peoples and 6% for Māori • This compares to a decrease by 11% for other groups
Rate of hospital readmissions is increasing • From 2002–2005, the number of readmission was approx 8% per year • From 2005–2010 this increased to 10.2%
Amenable Mortality trends Annual change in amenable mortality, 1997 to 2007 (or last year available) Amenable mortality in 31 OECD countries, 2007 or last year available
We are less likely to die from preventable causes • From 2000 to 2008 the most significant change in amenable mortality was the decrease among 65–74-year-olds
Average length of stay is decreasing • From 2001–2010, total ALOS has decreased from 4.4 to 4.1 days
Our system is relatively responsive to patients • Reasonably new indicator of system performance in NZ • Included in the continuous New Zealand Health Survey • Commonwealth Fund data available
Strong real increases in cost per output • Medical and nursing costs per output have increased by 27% in real terms • 4.1% per year on average during the 2003/04–2009/10 period, slowing to 1% in 2009/10 year
Six Health Targets • Shorter stays in emergency departments • Improved access to elective surgery • Shorter waits for cancer treatment • Increased immunisation • Better help for smokers to quit • Better diabetes and cardiovascular services
Systems Outcomes relative to health spendingSource: OECD Health Data 2011 Life Expectancy at Birth (Total Population) vs Health Spending per capita ($US PPP): 2009 or latest year Source: OECD Health Data 2009
Deviation from expected life expectancy at birth versus deviation from expected current health expenditure per capita, OECD countries 2009 (New Zealand 2003, 2005, 2007 and 2009)
Systems Outcomesrelative to growth in health spending(decline in amenable mortality under 75 from conditions responsive to health care) Annual average % change in total health spending per capita (NCUs) Annual average % change in Amenable Mortality 1998-2003 Relatively inefficient health care systems are above the trend line 95% confidence intervals for expected amenable mortality decline shaded blue Relatively efficient health care systems are below the trend line
Conclusion: System Performance • Health targets have been effective • ASH and hospital readmissions, room for improvement • Developing our understanding of patient experience • Careful consideration of efficiency and productivity • In terms of life expectancy relative to health spending, there is room for improvement to move us into the preferred quadrant of “longer life, less spending”