Download
1 / 1
10 likes | 114 Vues
Incremental Path Profiling Kevin Bierhoff and Laura Hiatt. Path Profiling. Incremental Approach. Experimental Results.

E N D
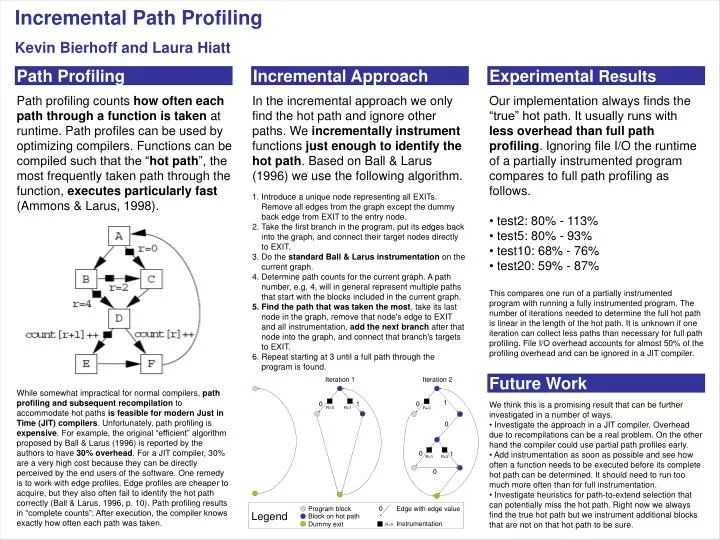
Incremental Path Profiling Kevin Bierhoff and Laura Hiatt Path Profiling Incremental Approach Experimental Results Path profiling counts how often each path through a function is taken at runtime. Path profiles can be used by optimizing compilers. Functions can be compiled such that the “hot path”, the most frequently taken path through the function, executes particularly fast (Ammons & Larus, 1998). In the incremental approach we only find the hot path and ignore other paths. We incrementally instrument functions just enough to identify the hot path. Based on Ball & Larus (1996) we use the following algorithm. • Our implementation always finds the “true” hot path. It usually runs with less overhead than full path profiling. Ignoring file I/O the runtime of a partially instrumented program compares to full path profiling as follows. • test2: 80% - 113% • test5: 80% - 93% • test10: 68% - 76% • test20: 59% - 87% • This compares one run of a partially instrumented program with running a fully instrumented program. The number of iterations needed to determine the full hot path is linear in the length of the hot path. It is unknown if one iteration can collect less paths than necessary for full path profiling. File I/O overhead accounts for almost 50% of the profiling overhead and can be ignored in a JIT compiler. • Introduce a unique node representing all EXITs. Remove all edges from the graph except the dummy back edge from EXIT to the entry node. • Take the first branch in the program, put its edges back into the graph, and connect their target nodes directly to EXIT. • Do the standard Ball & Larus instrumentation on the current graph. • Determine path counts for the current graph. A path number, e.g. 4, will in general represent multiple paths that start with the blocks included in the current graph. • Find the path that was taken the most, take its last node in the graph, remove that node's edge to EXIT and all instrumentation, add the next branch after that node into the graph, and connect that branch's targets to EXIT. • Repeat starting at 3 until a full path through the program is found. Future Work Iteration 1 Iteration 2 While somewhat impractical for normal compilers, path profiling and subsequent recompilation to accommodate hot paths is feasible for modern Just in Time (JIT) compilers. Unfortunately, path profiling is expensive. For example, the original “efficient” algorithm proposed by Ball & Larus (1996) is reported by the authors to have 30% overhead. For a JIT compiler, 30% are a very high cost because they can be directly perceived by the end users of the software. One remedy is to work with edge profiles. Edge profiles are cheaper to acquire, but they also often fail to identify the hot path correctly (Ball & Larus, 1996, p. 10). Path profiling results in “complete counts”: After execution, the compiler knows exactly how often each path was taken. 1 • We think this is a promising result that can be further investigated in a number of ways. • Investigate the approach in a JIT compiler. Overhead due to recompilations can be a real problem. On the other hand the compiler could use partial path profiles early. • Add instrumentation as soon as possible and see how often a function needs to be executed before its complete hot path can be determined. It should need to run too much more often than for full instrumentation. • Investigate heuristics for path-to-extend selection that can potentially miss the hot path. Right now we always find the true hot path but we instrument additional blocks that are not on that hot path to be sure. 0 1 0 R=0 R=1 R=0 0 0 1 R=1 R=2 0 0 Program block Edge with edge value Legend Block on hot path Instrumentation Dummy exit R=0