Download
1 / 53
530 likes | 760 Vues
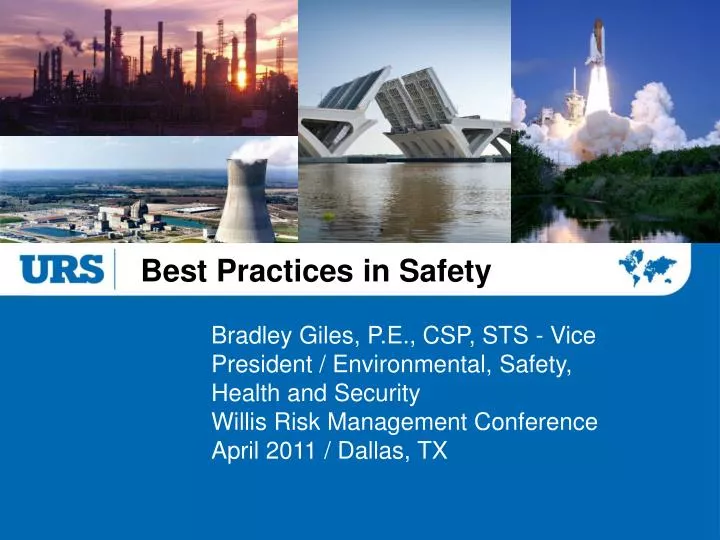
Best Practices in Safety. Bradley Giles, P.E., CSP, STS - Vice President / Environmental, Safety, Health and Security Willis Risk Management Conference April 2011 / Dallas, TX. “Safe Performance is Good Businessâ€. Values.

E N D
Best Practices in Safety Bradley Giles, P.E., CSP, STS - Vice President / Environmental, Safety, Health and Security Willis Risk Management Conference April 2011 / Dallas, TX
Values Our Executive Management views Safety Performance as a Leading Indicator of Project Management Performance with strong correlation to Quality, Schedule, Productivity, and Financial Success.
Values Integrity and Candor Competence and Professional Behavior Accountability and Responsibility Cooperation and Efficiency Safety DIVERSITY
Goal Our Goal: Through the Continuous Improvement Process, Achieving and Sustaining Zero Accidents.
Heritage Modern day construction hard hat use at Hoover Dam
Program Scope/Risk • High-hazard activities in execution of operations, construction, remediation, demolition and mining • 31,800 total managed workforce • 50,000 new project workers on annual basis • 90 million hours total managed exposure • Average age >51, 40% have multiple prescription drugs for physical limitations • Dynamic scheduling of workforce and subcontractors • Environmental physical/stress/exposures 7
Diverse Markets, Complex Projects, Extreme Conditions St. Lucie Nuclear Plant Steam Generator Replacement Heavy equipment replacement under radioactive conditions Kapuskasing Phosphate Mine O&M Arctic conditions: temperatures can fall to –56° C Holcim Cement Plant World’s largest single-clinker production line Waste Isolation Pilot Plant O&M Radioactive waste storage, nearly a half mile underground 8
Diverse Markets, Complex Projects, Extreme Conditions San Cristóbal Silver/Lead/Zinc Mine High-altitude working environment; indigenous workforce Olmsted Locks and Dam Producing 47 concrete shells; largest weighing 4,000+ tons Monroe Power Plant AQCS Retrofit Construction of scrubbers and new 580-foot chimney Savannah River Site – Defense Waste Processing Facility Treatment and disposal of radioactive liquid wastes 9
Program Scope/Risk Security in Iraq 20 Million Hours 2 million road miles traveled 272 incidents without injuries (small arms, IED, vehicle born explosives and RPG) • 10,000 protective security detail sorties, 900 security operatives • 19,800 clients moved • 110 attacks by small arms and indirect fired mortar rockets Protective Detail Vehicle Badji Camp Camp
How Safe Are We? Days Away Case Rate Number of Incidents per 100 Employees/Per Year
Division Performance • 0.57 EMR • 85% of Sites – No Recordable Injuries • 95% of Sites – No Days Away Injuries • President’s Awards: 275 since 2000, 600 Million Hours • Workers’ Compensation costs funded by the Division have been reduced by 85% from 2000 to 2010.
Talent • 1,100 Domestic ES&H Professionals • 1,050 International ES&H Professionals • 2,500 Safety Trained Supervisors Certified - (STS-C) Supervisors. • 50% of All STS from 1997-2011 are URS • First international STS – 50 Egyptian Nationals.
Market Leadership • Washington Group - 2004 America’s Safest Companies • Savannah River Site - 2005 America’s Safest Companies • Rust Constructors - 2006 America’s Safest Companies • URS Washington Division - 2008 America’s Safest Companies • Tom Zarges – NSC 2009 “CEO’s That Get It”
Market Leadership DOL - OSHA VPP Star Sites First 4 of 5 DOE • Rocky Mountain Arsenal • NASA White Sands • Monsanto • Port Washington • Boise Corporate Office • Anniston • Umatilla • Pine Bluff • Olmsted • Lockheed • Savannah River • West Valley • INEL • WIPP • Weldon Springs • Hanford
Market Leadership • 1st E&C Company in OSHA VPP “Corporate Pilot” • VPP Approval for Company Wide Programs 5th Company Overall
Market Leadership Construction Safety Excellence Awards Associated General Contractors (AGC) • Heavy Civil Division – Infrastructure Business Unit • 2004, 2008, 2011 • 2011 Grand Award ABC (Associated Builders and Contractors) • Rust Constructors • 2004, 2005, 2006, 2007, 2008, 2009, 2010 ROSPA (Royal Society for the Prevention of Accidents) • 12 Years Gold • 3 Years President’s (2009, 2010, 2011)
Market Leadership 1st Company to sign OSHA Alliance Agreement
Culture Safety is a core value and must be led and demonstrated from the top, with input and support from employees Executive Management: Sets the Cultural Tone Safety is everyone's personal responsibility Workers: Work Planning, Peer Observing, Training Champions Teams Peers
URS Zero Incident Approach Outcomes Path to Safety Excellence Leading Metrics Lagging Metrics Programitic/ Systems Physical (Conditions) Behavior (Action) Initiatives Culture, Perceptions Incident Tools Safety Engagement Survey PEPs SMS OSHA Challenge Regulatory compliance Audits/Inspections Observations & Feedback loops: People-based safety program Leading Indicators DAC TRC Near Miss Observations vs. Goal Targets Targets Self Assessment Audit Scores Culture Scores Metrics Trailing Indicators
Core Value ES&H Composite Metric 100% 75% 50% 40% 30% 20% 15% 10% 5% 0% Overall Weighting Metric Weighting 100% Leading Metrics 15% Lagging Metrics 0% Scoring 95–100 90–94 85–89 80–84
2011 Safety Metrics Using Leading Indicators to Enhance Performance Provide real time measures Identifies potential problem areas in many cases before incidents occur Provides projects with improvement solutions • Leading Indicators Measure • Safety Management Systems implementation • Employee engagement / participation • Project field conditions related to OSHA requirements • Employee behaviors / perceptions • Safety Culture 2010 Safety Leading Indicators 23
Category Descriptions Employee Development / Participation (P) Attend Webcasts Human Performance Tools Objectives • Project Real Time Measures • - Conditions Assessment – Actual Score / 138 Checkpoints • - Safety Management Systems Self Assessment – Actual Score / 216 checkpoints • - Perception Survey • - Behavior Safety Program Key Tasks Obtain STS Certification – Complete Safe Driving Course Best Practices Personal Safety Action Plans (P) Stretch / Flex Pre-tasks Briefs Supervisor Inspections (P) Safety Bulletin Board Learning Lab Mentoring Program (P) Safety Committee (P) Safety Steering Committee (P) 2010 Safety Leading Indicators 24 24
Division Leading Indicators • Executives Attain STS • Executives Make Employee Contacts • Project Managers Conduct Monthly Safety Walks • Project Managers involved in New Employee Orientation • Sites Conduct OSHA VPP Self Assessments • Site Supervision Participate in Monthly Webcasts
Division Innovative Initiatives • Safety Considerations in Design • Voluntary Protection Programs • Cultural Gap Analysis Results • Employee Safety Engagement Surveys • Safety Learning Labs • Stretch and Flex • Worksteps – Fitness for Duty • People Based Safety – Peer to Peer Observation
Division Innovative Initiatives (Cont’d.) • Management of Change • Personal Safety Action Plan • G-Smart Data Management Program • Lessons Learned Review • Defensive Driving • Crisis Management/Emergency Preparedness • Movesmart – Slip/Fall/Strain Prevention
Innovation “Safety Considerations in Design” • 16 Hour Class For: • Engineers • Designers • Estimators • Contract Administrators • Procurement Professionals • Trained Exxon Mobile and NASA! Over 2,000 Trained Over the Last 3 Years
Cultural Gap Analysis Program The Cultural Gap Analysis Program: Serves as an evaluation tool for the Safety Culture Measures safety-system effectiveness Quality Consistency Depth Identifies strengths and weakness (GAPs) • Belonging • Involvement • Credibility • Growth • Measurement • Supervisor Impact • Leadership • Goals • Beliefs • Ethics • Implementation • Communication • Operations • Accountability
Our Current Culture Is? • 97% Believe Senior Mgt is Serious About Safety • 92 % Feel They Receive Quality Training to do Job • 96% Respect Their Supervisor as a Leader • 95% Would Recommend a Friend to Work Here • 95% Are Proud to Work with Washington Division Current Survey for Employee Engagement
Innovation Safety Trained Supervisor (STS) • Construction • General Industry • Petro/Chemical • Mining Council on Certification of Health, Environmental and Safety Technologists (BCSP)
STS A Safety Certification for New Safety Professionals: • Completes 30 Hours Safety Related Training • Two Years Experience in Industry • One Year Experience in Supervision THE SINGLE BEST ACTIVITY WE HAVE USED TO IMPROVE SAFETY CULTURE
Culture Safety Trained Supervisor (STS) Certification STS utilized as the platform for our culture STS is a Safety Certification for non safety professionals Safety training and knowledge retention is path to supervisor involvement Certification process validates supervisor’s knowledge Recertification process provides continued learning Supervisor utilizes safety as a resource Supervisors sign an ethics statement Supervisors make “Safety” based decisions 2,500 Safety Trained Supervisors 50% of all STS are URS employees 50 Egyptian nationals – First International STS 13 Sellafield Employees – First UK STS (June 28, 2010)
Innovation • Learning Laboratory
Innovation • Stretch & Flex Warm Ups “Construction Athletes”
Practices Participation in Professional Organizations: • Board of Certified Safety Professionals (BCSP) • Council on Certification of Health, Environmental and Safety Technologists (CCHEST) • American Society of Safety Engineers (ASSE) • Associated General Contractors (AGC) • National Institute for Occupational Safety and Health (NIOSH) • Utilize organizations as opportunities for professional development
Practices Support for Young Professionals • ASSE Scholarship • Internships • Co-Sponsor ASSE “Future Safety Leaders” • University Advisory Boards
Community Outreach • Safety Fest of the Great Northwest • Free Safety Training 2005-2011 • 6,650 People • 11,479 Seats • 460 Classes • Joint activity URS, OSHA & AGC • Public Schools Safety Inspections • Vocational Education Instructors • 10/30 Hour Safety Training
Executive Expectations • New Employee Orientations lead by PM • Start Meetings with a Safety Topic • JHA for Every Task • Stretch and Flex Each Morning • Immediate Notification of Injuries/Serious Incidents • PM’s Present Lessons Learned At Staff Mtgs • Complete Senior Management Checklist • Supervisors Achieved STS
PSAP Purpose To reduce your personal exposure and that of those around you to risks associated with an unsafe environment
Bradley D. Giles Vice President – Environmental, Safety & Health URS Corporation URS Corporation Bradley D. Giles 2010 Personal Safety Action Plan • Develop and implement leading indicators and metrics to support the continuous improvement process • Develop and implement peer to peer observation program • Discourage use of cell phones while driving for colleagues and family • Wear a helmet when motorcycling and skiing • Walk an average of 30 minutes per day • Lose 10% of weight through exercise and diet
Personal Risk ManagerThe Approach • The card is a tool you can personally use to measure risk. • Risk is a personal perception. That’s why some people sky dive while others won’t. • Whether we take the “risk” or not is based upon our perception of the risk level, our control of the variables, and the potential outcome of the event. • This tool gives you the ability to “qualify” if the risk of a job task is extreme or low and it provides a checklist for assessing and correcting risk factors.
Personal Risk Management: Basic Components Personal safety comes down to basically three components: • Recognizing the hazard and conditions that could lead to an incident. • Assessing the potential consequences of an activity. • Controlling the hazard and thus eliminating or reduce the risk.