Download

1 / 30
640 likes | 1.7k Vues
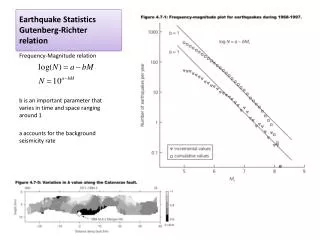
The Gutenberg-Richter b value. Karen Felzer USGS, Pasadena. The global magnitude-frequency relationship: Gutenberg-Richter with b =1. 1976-2005 Global CMT catalog. Slope = b =1.0. log(N) = a - b M. Hutton et al. (2010) obtained b =1.0 for Southern California .

E N D
The Gutenberg-Richter b value Karen Felzer USGS, Pasadena
The global magnitude-frequency relationship: Gutenberg-Richter with b=1 1976-2005 Global CMT catalog Slope = b =1.0 log(N) = a - bM
Hutton et al. (2010)obtained b=1.0 for Southern California Figure 13, Hutton et al. (2010)
Lower b values are often reported because it is easy to use a value of Mc that is too small Probability of earthquake detection = 1 - C10-M Setting the catalog completeness threshold by eye can lead to b value underestimation by 0.1 to 0.2.
Magnitude error can also cause miscalculation of b values 1984-1999 Southern California Catalog b value inflated by magnitude error • Larger magnitude errors for smaller earthquakes inflate b • b is best fit at the largest reasonable minimum magnitude
Erroneous b values also frequently result from data sets that are too small n b range >2000 good quality earthquakes are required for 98% confidence errors < 0.05
Declustering reduces b value in routines where the smaller earthquakes in a cluster are preferentially removed Sorry, but according to our b value you didn’t have an earthquake! Christchurch, M 6.3
The Wiemer and Schorlemmer method uses b value asperities and is #2 in the RELM test Weimer and Schorlemmer 5 year forecast
The Helmstetter et al. forecast uses uniform b value and is #1 in the RELM test Helmstetter et al. 5 year forecast
Case study: Wiemer and Schorlemmer (2007) argue that they see a lot of b value variability at Parkfield
We can recover similar “variability” with a simulated catalog with a uniform b value, and the incompletness and rounding found in the Parkfield catalog Two random simulations
Taking a statewide survey, we find little b value variation in 1° x 1° bins 1984 - 2004 Minimum of 30 earthquakes/calculation Assuming no magnitude error and uniform catalog completeness to M 2.6, all values are0.9 ≤ b ≤1.1. Same for 0.5 °x 0.5 °, 0.25 °x 0.25 °, 0.1° x 0.1 ° bins
Is the magnitude-frequency distribution different on and off of major faults? ?
Identify the distributions taken from major fault zones* (B) (C) (A) (E) (F) (D) *Fault zone: +-2 km from entire surface trace of mapped fault. All data from California, 1984-2004
Hayward Identify the distributions taken from major fault zones* Random SAF (B) (C) (A) SAJ Random Random (F) (E) (D) *Fault zone: +-2 km from entire surface trace of mapped fault All data from California, 1984-2004
Identify the distributions taken from major fault zones (A) (B) (D) (C) All distributions are purposely chosen around a large earthquake. All data from California, 1984-2004
Identify the distributions taken from major fault zones Random Calaveras (A) (B) Garlock Random (D) (C) All of these earthquake distributions are purposely centered around a large earthquake in the catalog
The San Andreas fault at Parkfield has b=1 M 6 Parkfield earthquakes are simply an expected part of the G-R distribution (Jackson and Kagan, 2006)
Conclusions • Seismicity in most of California follows the Gutenberg-Richter magnitude frequency relationship with b=1. • There is no evidence for significant b value variation with location or on/off of major faults. • The bvalue should generally be solved for with >2000 earthquakes that are clearly above the completeness threshold and that have minimal magnitude errors or rounding.
The historic record along the full SAF 1812-2006 eqs, ± 10 km from SAF Complete? Incomplete Catalog is too incomplete, short, and error-prone, but Gutenberg-Richter is suggested
Common Errors in b value Calculation • Fitting data with linear least squares (LSQ) rather than the simple maximum likelihood (MLE) method (read Aki (1965)) • Data set is too small • Using earthquakes smaller than the catalog completeness threshold • Using data with magnitude errors
Two Important Questions • Does b value vary with location?(Wiemer and Wyss, 1997; Schorlemmer and Wiemer, 2004…) • Does the magnitude-frequency distribution vary on and off of major faults? (Wesnousky et al. 1983; Schwartz and Coppersmith, 1984…)
Error #1: Fitting with least squares rather than MLE b value solved from 100 trials with 500 simulated earthquakes each; true b=1.0. LSQ solutions MLE solutions • MLE solutions are closer to the true value of b
Why the value of b is important Hazard Analysis:Small changes in b => large changes in projected numbers of major earthquakes Example 10 M ≥ 7 eqs b = 1.0 10,000 M ≥ 4 earthquakes b = 0.9 20 M ≥ 7 eqs Earthquake Physics:The magnitude distribution reflects fundamental properties of how earthquakes grow and stop.
Error #1: Fitting with linear least squares (LSQ) rather than MLE LSQ assumes the error at each point is Gaussian rather than Poissonian LSQ assumes the error on each point is equal • LSQ is disproportionately influenced by the largest earthquakes • MLE weighs each earthquake equally