Download
1 / 14
140 likes | 305 Vues
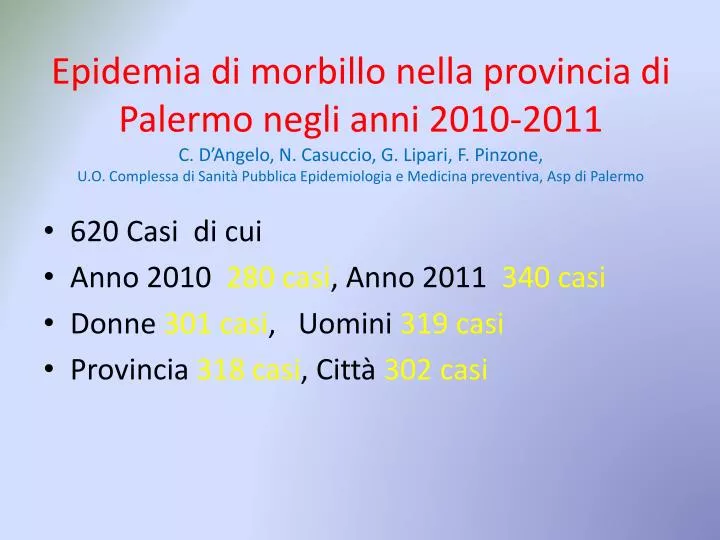
Epidemia di morbillo nella provincia di Palermo negli anni 2010-2011 C. D’Angelo, N. Casuccio , G. Lipari, F. Pinzone , U.O. Complessa di Sanità Pubblica Epidemiologia e Medicina preventiva, Asp di Palermo. 620 Casi di cui Anno 2010 280 casi , Anno 2011 340 casi

E N D
Epidemia di morbillo nella provincia di Palermo negli anni 2010-2011C. D’Angelo, N. Casuccio, G. Lipari, F. Pinzone, U.O. Complessa di Sanità Pubblica Epidemiologia e Medicina preventiva, Asp di Palermo • 620 Casi di cui • Anno 2010 280 casi, Anno 2011 340 casi • Donne 301 casi, Uomini 319 casi • Provincia 318 casi, Città 302 casi
Classe di età Stato vaccinale <5 5-14 >14 Tot. NON NOTO 0.10 0.23 0.32 146 NON VACCINATO 0.88 0.73 0.63 452 VACCINATO 0.02 0.04 0.04 22 χ2= 2.8933, df = 1, p-value = 0.08895 Classi di età Ospedalizzazione <5 5-14 >14 Tot. NO 0.76 0.57 0.64 411 SI 0.23 0.42 0.35 209 χ 2 = 0.0807, df = 1, p-value = 0.7763
Tassi per indice di deprivazione territoriale (Palermo città) Indice tasso tasso l.c. l.c. grezzo std inf. sup. 1 5.2 5.5 4.2 7.0* 2 6.2 6.2 4.9 7.8 3 7.6 7.3 5.8 9.0 • 9.8 9.3 7.2 11.8* Indice: Affluente< – 1 – 2 – 3 – 4 –> Deprivato *Differenza significativa p<.05