Download
1 / 2

E N D
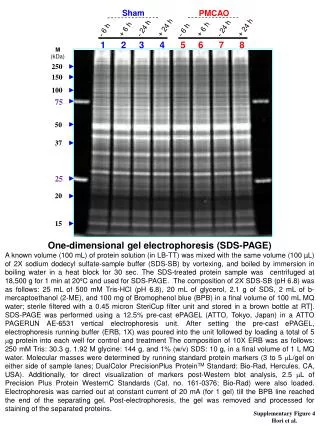
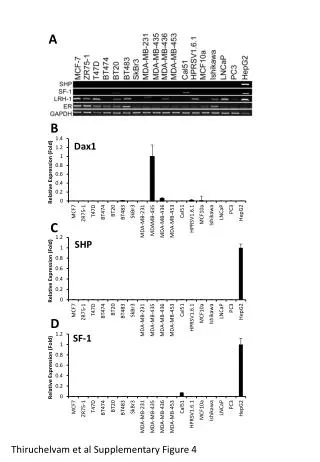
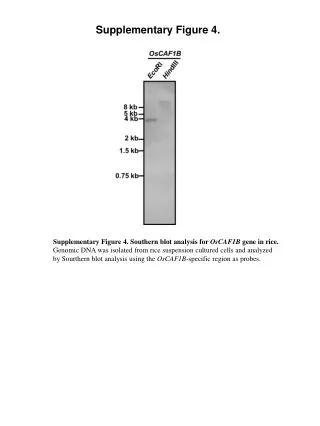
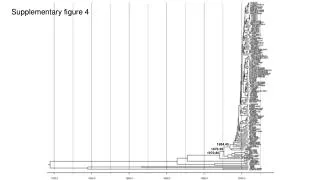
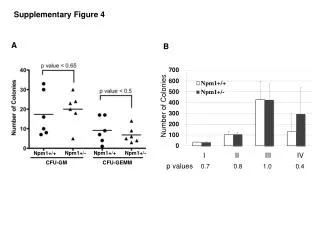
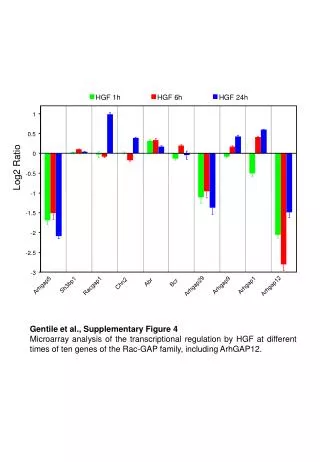
Supplementary Figure 4: A) PBX1 expression in subsets of high-risk NB, consisting of MYCN-amplified tumors from survivors (MYCNampHR Alive) or nonsurvivors (MYCNampHR DOD) (p=0.12), or MYCN-nonamplified tumors from survivors (MYCNnonampHR Alive) or nonsurvivors (MYCNampHR DOD)(p=0.22) . Relative PBX1 expression was measured by RT-qPCR as in Figure 5. B) Event-free survival (EFS, dashed lines, p=0.00016) comparison using PBX1 expression of the Oberthuer dataset of 251 patients of all stages. Median expression of PBX1 was used to stratify patients high (red) versus low (black) PBX1 expression in this graph. C) PBX1 expression in tumors from patients under 18 months of age within the Khan dataset (n=30). The three patients who died of disease within this group all had significantly lower PBX1 expression compared to the 27 patients who survived (p=0.0052). D) PBX1 expression in high-risk tumors without MYCN amplification from the Khan dataset (n=18). Tumors from survivors in this group had significantly higher PBX1 expression than tumors from nonsurvivors (p=0.0125).
A Supplementary Figure 4 NS NS B *** C D