Download
1 / 15
160 likes | 293 Vues
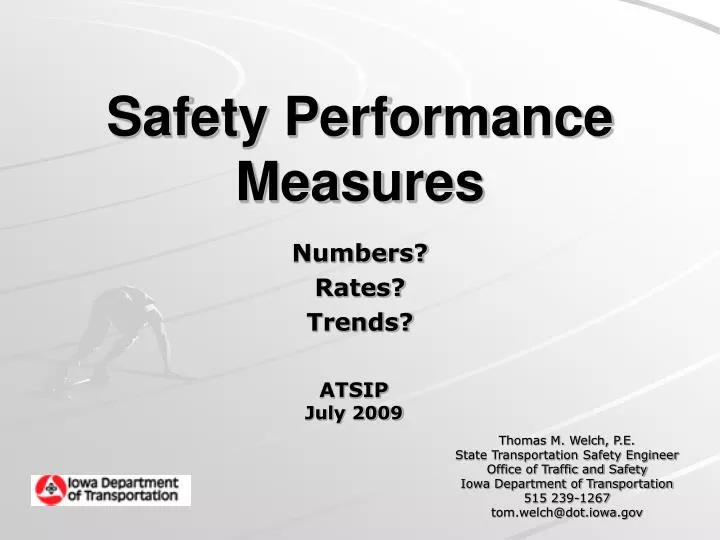
Safety Performance Measures. Numbers? Rates? Trends?. ATSIP July 2009. Thomas M. Welch, P.E. State Transportation Safety Engineer Office of Traffic and Safety Iowa Department of Transportation 515 239-1267 tom.welch@dot.iowa.gov. Reduce the national fatality rate from 1.48 to 1.0

E N D
Safety Performance Measures Numbers? Rates? Trends? ATSIP July 2009 Thomas M. Welch, P.E. State Transportation Safety Engineer Office of Traffic and Safety Iowa Department of Transportation 515 239-1267 tom.welch@dot.iowa.gov
Reduce the national fatality rate from 1.48 to 1.0 …One state at a time 2003 Shared National GoalAASHTO, FHWA, NHTSA, GHSA, FMCSA
Fatality Rates per 100 Million VMT – 2002 US Avg. = 1.50 1.01 1.20 0.81 1.47 2.60 1.32 1.20 1.26 0.86 1.86 1.37 1.14 2.12 1.95 1.28 1.03 1.54 1.31 1.03 1.64 1.31 1.11 1.09 2.12 1.34 1.34 1.27 2.19 1.70 1.40 1.18 1.80 1.77 1.95 1.23 1.70 1.72 1.33 DC 1.61 2.18 2.13 2.23 1.97 1.41 1.80 2.43 1.69 2.02 1.78 1.76 0.00 to 1.50 1.50 to 2.61 1.34 PR VI
Fatality Rates Can Be Misleading 2.12 SD 1.27 CA South Dakota’s roads are safer than California’s
2006 Fatality Rates National Iowa Difference Overall 1.41 1.40 None Rural Roads 2.30 1.80 -22% Urban Streets 0.95 0.80 -16%
(1.30) to zero zero to 0.83 Expected Fatality Rates (Weighted by Distribution of VMT) Compared to Actual Fatality Rates (0.76) (0.16) (1.26) (0.54) 0.64 (0.65) (0.46) (0.39) (0.30) 0.06 (0.39) (0.25) 0.19 (0.08) 0.13 (0.23) (0.07) (0.02) (0.52) (0.17) (0.17) (0.17) 0.81 (0.57) (0.29) (0.02) 0.02 0.05 0.23 0.29 (0.33) 0.10 0.19 0.21 (0.15) 0.01 0.29 DC 0.17 (0.06) 0.79 0.23 0.30 0.44 (0.18) 0.12 0.46 0.23 0.34 0.19 0.41 (0.10) Puerto Rico Virgin Islands
Current Goal Reduce fatalities by 1/3 from ~ 43,000 to 29,000/ year
State of IowaFatalities and Major Injuries Which Year Was Safer???
Safety Performance Measures Safety Performance Measures Numbers? Rates? Trends? Thomas M. Welch, P.E. State Transportation Safety Engineer Office of Traffic and Safety Iowa Department of Transportation 515 239-1267 tom.welch@dot.iowa.gov ATSIP July 2009