Download
1 / 6
70 likes | 231 Vues
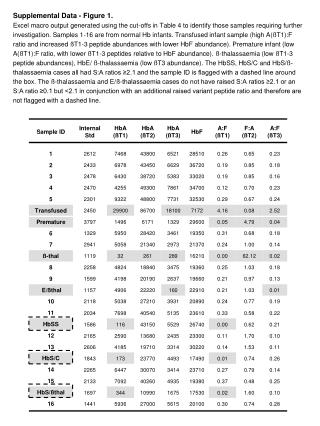
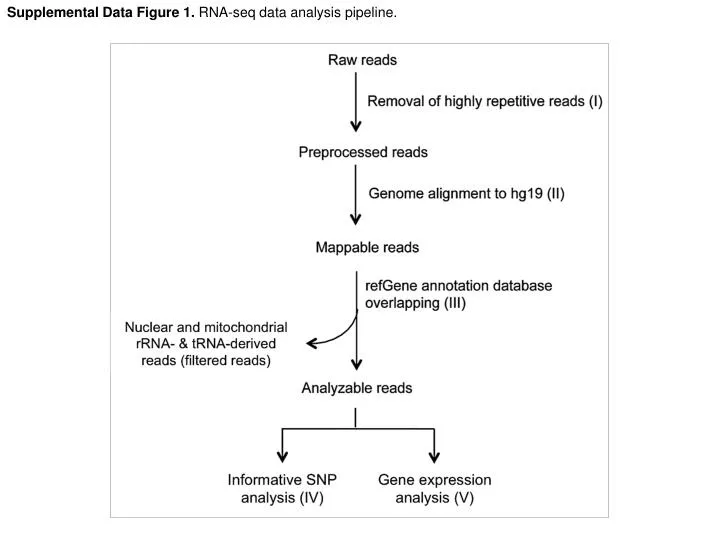
Supplemental Data Figure 1. RNA-seq data analysis pipeline. Supplemental Data Figure 2. Workflow of informative SNP analysis on RNA transcripts.

E N D
Supplemental Data Figure 2. Workflow of informative SNP analysis on RNA transcripts.
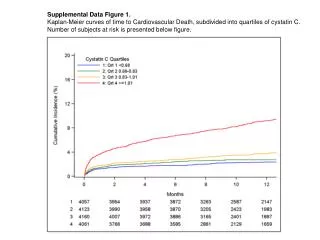
Supplemental Data Figure 3. Cut-offs defined for identifying informative SNP loci of high fetal or maternal contribution. Each point represents one informative SNP locus. Informative SNP loci fell within the un-shaded regions were those of high fetal or maternal contribution.
Supplemental Data Figure 4. (A) GC% distribution of sequenced reads from the RNA-seq libraries of M9356P (with Ribo-Zero Gold pre-treatment) and M9415P (without Ribo-Zero Gold pre-treatment). (B) Correlation of gene expression profiles between M9356P and M9415P.
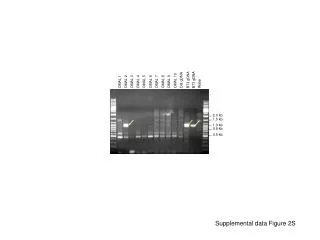
Supplemental Data Figure 5.Detection of maternal H19 methylation status by methylation-sensitive restriction enzyme digestion.
Supplemental Data Figure 6. Five of the six transcripts, i.e., STAT1, GBP1, HSD17B1, KRT18 and GADD45G mRNA expressions, were significantly decreased after delivery (P < 0.05, Wilcoxon signed rank test).