Download
1 / 26
260 likes | 455 Vues
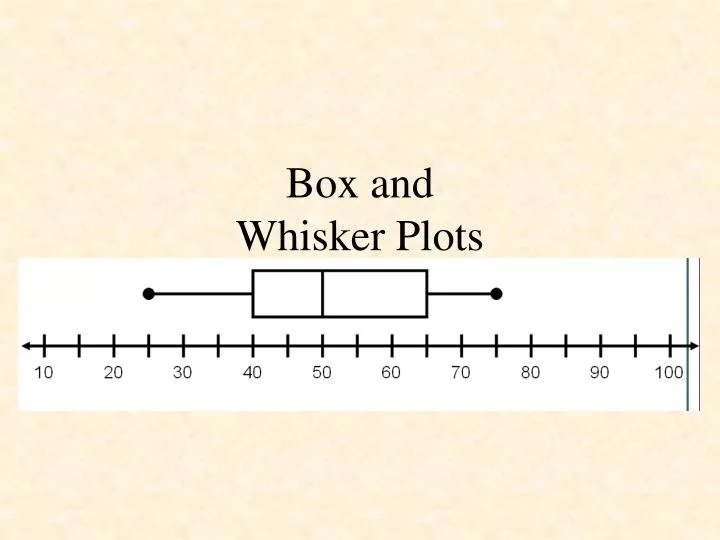
Box and Whisker Plots. Activities. Mean and Median Applet This applet allows the user to investigate the mean, median, and box-and-whisker plot for a set of data that they create. The data set may contain up to 15 integers, each with a value from 0 to 100. What’s in a Name? (lesson 4)

E N D
Activities Mean and Median Applet This applet allows the user to investigate the mean, median, and box-and-whisker plot for a set of data that they create. The data set may contain up to 15 integers, each with a value from 0 to 100. What’s in a Name? (lesson 4) Students create a box and whisker plot and compare the mean, median, and mode of a set of data. Eat Your Veggies! (lesson 6) In this lesson, students construct box-and-whisker plots. Students use the box-and-whisker plots to identify the mean, mode, median, and range of the data set. Representation is the major focus of this lesson. Penny Drop Students count the number of drops of two different solutions that a penny can hold. They then make a box-and-whisker plot of each solution, one as a class and one on their own and analyze the results.