Download
1 / 17
190 likes | 349 Vues
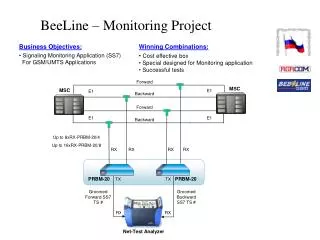
Funded by. Perth subsidence monitoring project. Mick Filmer 1 , Will Featherstone 1 , Andreas Schenk 2 & in conjunction with Landgate and ARC 1 Western Australian Centre for Geodesy, Curtin University 2 Geodetic Institute, Karlsruhe Institute of Technology, Germany

E N D
Funded by Perth subsidence monitoring project Mick Filmer1, Will Featherstone1, Andreas Schenk2 & in conjunction with Landgate and ARC 1Western Australian Centre for Geodesy, Curtin University 2Geodetic Institute, Karlsruhe Institute of Technology, Germany M.Filmer@curtin.edu.au; +61 8 9266 2582
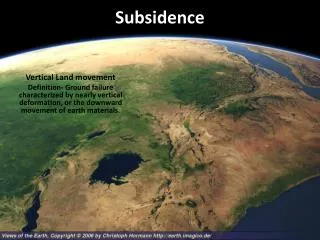
Vertical land motion (VLM) • Groundwater extraction results in VLM (usually subsidence) • Groundwater extraction in Perth increased ~1997 • Evidence of subsidence up to ~6 mm/yr from CGNSS Left panel: Subsidence of ~9 m between 1925 and 1977 in California. From Galloway & Burbey(2011)
Why is it necessary to monitor VLM? • Risk of damage to physical infrastructure • Houses/buildings • Transport infrastructure • Distortion and changes of AHD heights – Landgate is mandated to supply accurate heights • Benchmarks on vertical datum (AHD) • Tide gauges in Earth-centred reference frame
Heights change over time • AUSGeoid09 will not deliver AHD correctly, because benchmarks are moving vertically • HAHD = h – AG09fitted – Δht(φ,λ,t)
Aims of the project • Quantify subsidence of the Perth Basin • including spatial and temporal variations • Combination of InSAR, CGNSS, repeat levelling • InSAR delivers high spatial resolution over large area • Develop vertical velocity model for Perth region • provide users with corrected transformation to AHD using GNSS • Correct tide gauge records for VLM • Fremantle is longest record in Southern Hemisphere
Few knew that Perth was sinking • Lack of dedicated geodetic monitoring system – we need data! • Two CGNSS stations (only since ~1993) • Limited repeat GNSS observations • Little repeat levelling • Few archived InSAR images • 10 ERS • 12 Envisat I2 • 11 Envisat I3 • 21 ALOS PALSAR images, but cost $$$
The status quo – a lot more required • Now three CGNSS stations • Extracted 1970s levelling (black) • Repeat levelling (red)
GNSS - Gnangara • Subsidence correlates with increased water extraction • At this location for 1998-2012: • ~-5 cm height change • ~-25 m water level change Top panel: GPS ellipsoidal height (m) Bottom panel: Depth (m) of water in Yarragadee aquifer
GNSS - Hillarys • Lots of discontinuities and noise in the time series • Complicates estimating VLM trends • Subsidence makes TG observed sea level rise appear faster Top panel: GPS at Hillarys (antenna is above sign) Bottom panel: GPS ellipsoidal height (m)
InSAR introduction • Multiple radar images from repeat passes of the same satellite • Interferogram is formed by differencing images pixel-by-pixel • Multiple interferograms stacked to compute VLM time series Figure is of ALOS (Japanese Aerospace Exploration Agency) http://www.eorc.jaxa.jp/ALOS/en/about/palsar.htm
InSAR preliminary results • Envisat I3 deformation map 2008-2009 • Contaminated by atmospheric signal • Short time-series (1 year) and only 11 InSAR images • PROBLEM: not enough data Envisat data provided by European Space Agency (ESA)
InSAR preliminary results • TerraSAR-X deformation map Oct 2012-April 2013 • 12 images, but acquisitions continuing until end of 2013 • up to 36 images • not enough yet… TerraSAR-X data supplied by the German Space Centre (DLR) under GA-Curtin-Landgate-KIT science project
VLM by levelling • Advantages • High precision – proven for detecting VLM • Repeatable along same traverse • Archived data can extend back over time of deformation – data available, but in hardcopy • Disadvantages • Low spatial resolution • Relatively slow – usually low temporal resolution
Repeat levelling • Compare 1970s ΔH to 2011 re-levelled ΔH between Hillarys and Fremantle; Hillarys to Gnangara • E-W profile will compare 2013 re-levelling with 1970s ΔH • Re-levelling will be used to validate TerraSAR-Xand CGNSS time-series
The outlook • Perth’s water shortage woes will continue, especially as our population increases • Monitoring of Perth’s subsidence needs serious and ongoing $$$ commitment over time • We need lots of good data over a long time period: • more CGNSS stations dedicated to VLM • more InSAR [long, well sampled time-series – large image stack] • Expand re-levelling program
The outlook • Current project is funded by the Australian Research Council, Landgate, and Curtin University • Project ends December 2013 • Without additional funding, it will cease • Heights in Perth will degrade over time • Ongoing monitoring and solutions to the problem are dependent on the project continuing…
Acknowledgements • We would like to thank • European Space Agency, German Space Agency, Landgate, Geoscience Australia and the WA Department of Water for supplying data • Australian Research Council, Landgate and Curtin University for project funding • Andy Hooper (StaMPS), TUDelft (Doris), JPL/Caltech (roi_pac) for freely available InSAR software • Nigel Penna (Newcastle University, UK)