Download
1 / 175
1.75k likes | 1.98k Vues
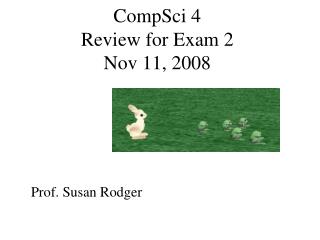
BA 3303 - Foundations of Finance Review for Exam 4 Chapters 11 - 14 Exam 4 will be given Wednesday, August 3, 2011. Exam 4 – Questions Distribution. Forms of Business Own’p Sole Proprietorship Partnership Corporation. Oprns. ( Etc. ). Sales. Finance. Acctg. 6. 10.

E N D
BA 3303 - Foundations of Finance Review for Exam 4 Chapters 11 - 14 Exam 4 will be given Wednesday, August 3, 2011
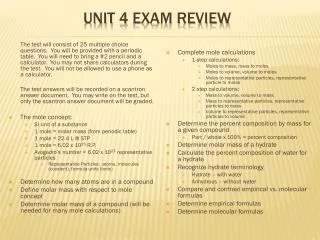
Exam 4 – Questions Distribution • Forms of Business Own’p • Sole Proprietorship • Partnership • Corporation Oprns ( Etc. ) Sales Finance Acctg 6 10 • Statements • Income Statement • Balance Sheet • Statement of Cash Flows Financial Statements 6 7 5 Capital Budgeting Ratio Analysis Long-Term Planning • Techniques • “Percentage of • Sales” • Cost-Volume-Profit • Stages • Identification * • Development * • Selection * • Implementation • Follow-up • Categories • Liquidity • Asset Mgmt • Finl Leverage • Profitability • Market Value 3 3 9 Other: 1
Those who need money Those who have money “Finance” – What It Is (2) (3) $$ (1) (4) A promise of something of value MONEY & SAVINGS USES OF MONEY (5) * Checking accts, savings accts, investment funds, insurance premiums, pension funds * For personal use: consumables, durables, cars, houses, etc. * For business use: buildings, equipment, inventory, etc. (1)Making money available and accumulating it … (2)… then getting that money from those who have it … (3)… to those who need it … (4)… so that they can put it to use. (5)In return, those who receive the money promise something of value to those who provided it.
The 3 Sections of the Textbook PART 1 Institutions & Markets PART 2 PART 3 Financial Management Investments PART 1: Institutions = organizations and intermediaries that: (1) help accumulate savings, and (2) get those funds to individuals, businesses, and governments that will spend or invest them. Markets = forums that facilitate the flow of funds among individuals, businesses, and government. PART 2: Investments = the analysis, valuation, and sale of securities, and the management of the associated risk. PART 3: Financial Management = financial planning, asset management, and fund-raising decisions for a business.
Financial Management • Involves business people working • with financial institutions and • markets. • Involves business reporting, which • provides investors, management, • and the government info about the • financial health and direction of the • company. • Involves assessing projects for • viability and profitability, which • takes into account interest rates, • risk, stock prices, etc. • Involves getting funds via stocks • and bonds issued to the public.
How the “Parts of the Text” Relate to the “Business Framework” Part 1 Lenders Owners / Investors Government Environment Employees Part 2 * Production * Mgmt * Sales * IT * Logistics * R&D * Mktg * Facil. Mgmt * HR * Purchasing * Finance * Accounting Part 3 Neighbors Customers Competitors Suppliers Part 1 = “Institutions & Markets” Part 2 = “Investments” Part 3 = “Financial Management”
Financial Management • Forms of Business Own’p • Sole Proprietorship • Partnership • Corporation Oprns ( Etc. ) Sales Finance Acctg • Statements • Income Statement • Balance Sheet • Statement of Cash Flows Financial Statements Capital Budgeting Ratio Analysis Long-Term Planning • Techniques • “Percentage of • Sales” • Cost-Volume-Profit • Stages • Identification * • Development * • Selection * • Implementation • Follow-up • Types • Liquidity • Asset Mgmt • Finl Leverage • Profitability • Market Value
CHAPTER 11 Business Organization and Financial Data
Financial Management • Forms of Business Own’p • Sole Proprietorship • Partnership • Corporation Oprns ( Etc. ) Sales Finance Acctg • Statements • Income Statement • Balance Sheet • Statement of Cash Flows Financial Statements Capital Budgeting Ratio Analysis Long-Term Planning • Techniques • “Percentage of • Sales” • Cost-Volume-Profit • Stages • Identification * • Development * • Selection * • Implementation • Follow-up • Types • Liquidity • Asset Mgmt • Finl Leverage • Profitability • Market Value
Business Ownership Factors: Which Form of Business? Source of Funding Legal Liability & Risk Allocation of Profits Managerial Control
Forms of Business Ownership Forms of Ownership (1) (2) (3) Sole Proprietorship Corporation Partnership * 72% of Firms * 5% of Revenues * 8% of Firms * 10% of Revenues * 20% of Firms * 85% of Revenues (1) Sole Proprietorship = “Business venture that is owned by a single individual, who personally receives all profit and assumes all responsibility for the debts and losses of the business.” (2) Partnership =“Form of business organization in which 2 or more people own a business operated for profit.” They share in profits and liabilities. (3) Corporation =“Legal entity created under state law with unending life that offers limited financial liability to its owners.”
Forms of Business Ownership = “Strength” = “Weakness”
Income Statement - p. 302 in text “Revenues & Expenses” Revenues < Cost of Goods Sold > Gross Profit < Selling, General, & Administrative Expenses > < Depreciation > Operating Income (or EBIT) < Interest > Net Income Before Taxes (NIBT) < Taxes > Net Profit, Earnings, NIAT Income to Bond holders Corporate Income Tax Belongs to Stock holders, or Owners Personal Income Tax One of 3 things can be done with the Earnings: (1) Pay it to Stock holders as income = “Dividend” (2) Retain it, and reinvest it in the company (3) Retain it, and hold it as cash or securities
Financial Management • Forms of Business Own’p • Sole Proprietorship • Partnership • Corporation Oprns ( Etc. ) Sales Finance Acctg • Statements • Income Statement • Balance Sheet • Statement of Cash Flows Financial Statements Capital Budgeting Ratio Analysis Long-Term Planning • Techniques • “Percentage of • Sales” • Cost-Volume-Profit • Stages • Identification * • Development * • Selection * • Implementation • Follow-up • Types • Liquidity • Asset Mgmt • Finl Leverage • Profitability • Market Value
Annual Report Annual Report: “Contains descriptive information and numerical records on the operating and financial performance of a firm during the past year” Operations & Financial Hilights Business Opportunities & Goals Annual Report Financial Reports Statement of Cash Flows Income Statement Balance Sheet
Financial Reports Financial Reports (1) (2) (3) Statement of Cash Flows Income Statement Balance Sheet * “Revenues & Expenses” * Operating info over time period * “Assets & Liabilities” * Snapshot at end of time period * “Sources (Inflows) & Uses (Outflows) of Cash” * Change from prev. time period (1) Income Statement = “Reports the revenues generated & expenses incurred by a firm over an accounting period.” Accrual method… remember? (2) Balance Sheet =“A statement of a company’s financial position as of a particular date.” (3) Statement of Cash Flows =“Provides a summary of cash inflows (sources) and outflows (uses) during a specified reporting period.”
ACCOUNTING: Focuses on “accrual method” = revenues and corresponding expenses are recognized when a sale occurs. FINANCE: Focuses on “cash flows” = when cash revenues are received and cash expenses are paid. Income Statement “Revenues & Expenses” Revenues < Cost of Goods Sold > Gross Profit < Selling, General, & Administrative Expenses > < Depreciation > Operating Income (or EBIT) < Interest > Net Income Before Taxes (NIBT) < Taxes > Net Profit, Earnings, NIAT Income to Bond holders Belongs to Stock holders, or Owners One of 3 things can be done with the Earnings: (1) Pay it to Stock holders as income = “Dividend” (2) Retain it, and reinvest it in the company (3) Retain it, and hold it as cash or securities
Income Statement - p. 302 in text “Revenues & Expenses” Revenues < Cost of Goods Sold > Gross Profit < Selling, General, & Administrative Expenses > < Depreciation > Operating Income (or EBIT) < Interest > Net Income Before Taxes (NIBT) < Taxes > Net Profit, Earnings, NIAT Income to Bond holders Belongs to Stock holders, or Owners One of 3 things can be done with the Earnings: (1) Pay it to Stock holders as income = “Dividend” (2) Retain it, and reinvest it in the company (3) Retain it, and hold it as cash or securities
ACCOUNTING: Depreciates assets according to set schedules, so that their accounting value decreases over time. FINANCE: Also interested in the actual and replacement value. Balance Sheet “Assets & Liabilities” Assets Current Assets Fixed Assets “Financial and physical items owned by a bus.” Expected life is > 1 year. Expected to be turned into Cash < 1 year. Liabilities Current Liabilities “Creditors’ claims on a firm.” Long-Term Liabilities Expected to be paid < 1 year. Expected to be paid > 1 year. Owner’s Equity Preferred Equity Retained Earnings “Funds supplied by the owners that represent their residual claim in the firm.” Common Equity
Balance Sheet “Assets & Liabilities” Assets Current Assets Fixed Assets “Financial and physical items owned by a business.” Expected life is > 1 year. Expected to be turned into Cash < 1 year. Liabilities Current Liabilities “Creditors’ claims on a firm.” Long-Term Liabilities Expected to be paid < 1 year. Expected to be paid > 1 year. Owner’s Equity Preferred Equity Retained Earnings “Funds supplied by the owners that represent their residual claim in the firm.” Common Equity
Balance Sheet – p. 304 in text * Cash & Marketable Securities * Accounts Receivable * Inventories * Other Current Assets CURRENT ASSETS FIXED ASSETS (ie, Plant, Equipt, etc.) TOTAL ASSETS * Accounts Payable * Notes Payable * Other Current Liabilities CURRENT LIABILITIES LONG-TERM LIABILITIES (ie, LT Debt) TOTAL LIABILITIES * Preferred Equity * Common Equity * Retained Earnings TOTAL OWNERS EQUITY “Assets” - “Liabilities” = “Owners Equity”
Statement of Cash Flows “Sources & Uses” Statement of Cash Flows (1) (2) (3) Operating Activities Investing Activities Financing Activities (1) Operating Activities = the actual making and selling of the product. (2) Investing Activities =the purchasing and disposition of fixed assets. (3) Financing Activities =the funding of the firm’s activities.
Cash Flow Determination INCOME STATEMENT: Revenues < Cost of Goods Sold > Gross Profit < Selling, General, & Administrative Expenses > < Depreciation > Operating Income (or EBIT) < Interest > Net Income Before Taxes (NIBT) < Taxes > Net Profit, Earnings, NIAT Net Profit (or Earnings, or NIAT) is a good starting point for determining Cash Flow coming into the company. BUT, it is not totally accurate…
Cash Flow Determination INCOME STATEMENT: Revenues Cash flow different? < Cost of Goods Sold >Cash flow different? Gross Profit < Selling, General, & Administrative Expenses > < Depreciation >NOT a cash outflow!! Operating Income (or EBIT) < Interest > Net Income Before Taxes (NIBT) < Taxes > Net Profit, Earnings, NIAT
Cash Flow Determination INCOME STATEMENT: Revenues Cash flow different? < Cost of Goods Sold >Cash flow different? Gross Profit < Selling, General, & Administrative Expenses > < Depreciation >NOT a cash outflow!! Operating Income (or EBIT) < Interest > Net Income Before Taxes (NIBT) < Taxes > Net Profit, Earnings, NIAT EXAMPLE: $100,000 Sales (Revenues) $ 75,000 Payments (cash in) $ 25,000 Increase in “Accts Receivable” EXAMPLE: $ 50,000 Inventory Cost (COGS) $ 40,000 Payments (cash out) $ 10,000 Increase in “Accts Payable” • Income Statement: • “Revenues” overstates “CASH IN” by $25k • “Cost of Goods Sold” overstates “CASH OUT” by $10k • So, we must assess the Balance Sheet accounts to • determine how much to adjust the IS numbers…
Cash Flow Determination - EXAMPLE INCOME STATEMENT: Revenues $100,000 < Cost of Goods Sold > < $ 50,000 > Gross Profit $ 50,000 < Other Expenses > < $ 20,000 > < Depreciation > < $ 10,000 > Operating Income (or EBIT) $ 20,000 < Interest > < $ 5,000 > Net Inc. Before Taxes (NIBT) $ 15,000 < Taxes > < $ 3,000 > Net Profit, Earnings, NIAT $ 12,000 So, these are the payments / receipts for the period: CASH INCASH OUTTOTAL Cash rec’vd for Sales: 75,000 “Accts Rec’v” payments: 15,000 Cash paid for materials: < 40,000 > “Accts Payable” payments: < 30,000 > . . . . TOTAL: 90,000 < 70,000 > 20,000
Cash Flow Determination - EXAMPLE INCOME STATEMENT: Revenues $100,000 < Cost of Goods Sold > < $ 50,000 > Gross Profit $ 50,000 < Other Expenses > < $ 20,000 > < Depreciation > < $ 10,000 > Operating Income (or EBIT) $ 20,000 < Interest > < $ 5,000 > Net Inc. Before Taxes (NIBT) $ 15,000 < Taxes > < $ 3,000 > Net Profit, Earnings, NIAT $ 12,000 So, these are the payments / receipts for the period: CASH INCASH OUTTOTAL Cash rec’vd for Sales: 75,000 “Accts Rec’v” payments: 15,000 Cash paid for materials: < 40,000 > “Accts Payable” payments: < 30,000 > . . . . TOTAL: 90,000 < 70,000 > 20,000
Cash Flow Determination - EXAMPLE INCOME STATEMENT: Revenues $100,000 < Cost of Goods Sold > < $ 50,000 > Gross Profit $ 50,000 < Other Expenses > < $ 20,000 > < Depreciation > < $ 10,000 > Operating Income (or EBIT) $ 20,000 < Interest > < $ 5,000 > Net Inc. Before Taxes (NIBT) $ 15,000 < Taxes > < $ 3,000 > Net Profit, Earnings, NIAT $ 12,000 So, these are the payments / receipts for the period: CASH INCASH OUTTOTAL Cash rec’vd for Sales: 75,000 “Accts Rec’v” payments: 15,000 Cash paid for materials: < 40,000 > “Accts Payable” payments: < 30,000 > . . . . TOTAL: 90,000 < 70,000 > 20,000
Cash Flow Determination - EXAMPLE BALANCE SHEET : PREVIOUSCHANGE CURRENT * Cash & Marketable Securities * Accounts Receivable 50,000 10,000 60,000 * Inventories * Other Current Assets CURRENT ASSETS FIXED ASSETS (ie, Plant, Equipt, etc.) TOTAL ASSETS * Accounts Payable 40,000 < 20,000 > 20,000 * Notes Payable * Other Current Liabilities CURRENT LIABILITIES LONG-TERM LIABILITIES (ie, LT Debt) TOTAL LIABILITIES * Preferred Equity * Common Equity * Retained Earnings TOTAL OWNERS EQUITY 25,000 – 15,000 Increase in Asset Acct is Cash Out (“Use”) 10,000 – 30,000 Decrease in Liability Acct is Cash Out (“Use”) TOTAL CASH ADJUSTMENT: 10,000 + 20,000 = 30,000 “out” So, these are the payments / receipts for the period: CASH INCASH OUTTOTAL Cash rec’vd for Sales: 75,000 “Accts Rec’v” payments: 15,000 Cash paid for materials: < 40,000 > “Accts Payable” payments: < 30,000 > . . . . TOTAL: 90,000 < 70,000 > 20,000
Cash Flow Determination - EXAMPLE INCOME STATEMENT: Revenues $100,000 < Cost of Goods Sold > < $ 50,000 > Gross Profit $ 50,000 < Other Expenses > < $ 20,000 > < Depreciation > < $ 10,000 > Operating Income (or EBIT) $ 20,000 < Interest > < $ 5,000 > Net Inc. Before Taxes (NIBT) $ 15,000 < Taxes > < $ 3,000 > Net Profit, Earnings, NIAT $ 12,000 TOTAL CASH ADJUSTMENT: 10,000 + 20,000 = 30,000 “out” So, these are the payments / receipts for the period: CASH INCASH OUTTOTAL Cash rec’vd for Sales: 75,000 “Accts Rec’v” payments: 15,000 Cash paid for materials: < 40,000 > “Accts Payable” payments: < 30,000 > . . . . TOTAL: 90,000 < 70,000 > 20,000
Cash Flow Determination Cash Flows Determined By: Sources of . Cash . < Uses of . Cash > . Asset Acct Liability Acct Equity Acct < Cash Div. > < Increase > < Decrease > < Decrease > + Net Income + Depreciation + Decrease + Increase + Increase NOTE: the net Cash Flow will equal the change in the “Cash Account” from the previous Balance Sheet.
Cash Flow Determination - EXAMPLE INCOME STATEMENT: Revenues $100,000 < Cost of Goods Sold > < $ 50,000 > Gross Profit $ 50,000 < Other Expenses > < $ 20,000 > < Depreciation > < $ 10,000 > Operating Income (or EBIT) $ 20,000 < Interest > < $ 5,000 > Net Inc. Before Taxes (NIBT) $ 15,000 < Taxes > < $ 3,000 > Net Profit, Earnings, NIAT $ 12,000 Sources. .< Uses > . Asset Acct Liability Acct Equity Acct < Cash Div. > < Increase > < Decrease > < Decrease > + Net Income + Depreciation + Decrease + Increase + Increase
Cash Flow Determination - EXAMPLE BALANCE SHEET : PREVIOUSCHANGE CURRENT * Cash & Marketable Securities * Accounts Receivable 50,000 10,000 60,000 * Inventories * Other Current Assets CURRENT ASSETS FIXED ASSETS (ie, Plant, Equipt, etc.) TOTAL ASSETS * Accounts Payable 40,000 < 20,000 > 20,000 * Notes Payable * Other Current Liabilities CURRENT LIABILITIES LONG-TERM LIABILITIES (ie, LT Debt) TOTAL LIABILITIES * Preferred Equity * Common Equity * Retained Earnings TOTAL OWNERS EQUITY Sources. .< Uses > . Asset Acct Liability Acct Equity Acct < Cash Div. > < Increase > < Decrease > < Decrease > + Net Income + Depreciation + Decrease + Increase + Increase
Statement of Cash Flows – p. 307 in text * Net Income or < Loss > * Depreciation * Decrease or < Increase > in Current Asset accts * Increase or < Decrease > in Current Liability accts CASH FROM OPERATING ACTIVITIES * Sale or < Purchase > of Property, Plant, . Equipment, etc. . CASH FROM INVESTING ACTIVITIES * Issuance or < Repurchase > of Stock * Increase or < Decrease > in Long-Term Debt * < Dividends > . CASH FROM FINANCING NET CHANGE IN CASH Income Stmt, & “Current” Accts Fixed Assets Long Term Liabilities & Owners Equity
Financial Statements -- Applied to Personal Scenario -- A personal budget scenario… • You make $30,000 per year ($2,500 / mo) • You have $1,200 / mo in expenses • You are paying off 2 loans: $300 / mo • each for a student loan and for a car • loan • You have already saved $6,000 for a Rainy • Day fund • You invest $300 / mo in a Roth IRA
Financial Statements -- Applied to Personal Scenario --
Financial Statements -- Applied to Personal Scenario --
Financial Statements -- Applied to Personal Scenario -- A personal budget scenario… • You make $30,000 per year ($2,500 / mo) • You have $1,200 / mo in expenses • You are paying off 2 loans: $300 / mo • each for a student loan and for a car • loan • You have already saved $6,000 for a Rainy • Day fund • You invest $300 / mo in a Roth IRA What if you charged your $1,200 of expenses to a credit card, and did not pay it off in full?
Financial Statements -- Applied to Personal Scenario --
Financial Statements -- Applied to Personal Scenario --
Charging to a Credit Card and Not Paying It Off in Full Reasons To Not Charge… Higher Standard of Living Still Need to Pay It Off Paying More Due to Interest Extra Cash to Spend
Charging to a Credit Card and Not Paying It Off in Full Look at Financial Statement example… PV = $1200 expenses put on credit card I/Y = 1.5% ( assume 18% annual rate ) FV = 0 PMT = - $25 per month CPT [ N ] = 85.5 months Therefore, total paid for the $1200 is… $25 x 85.5 = $2137.48 What if you make a $50 per month payment… CPT [ N ] = 30.0 months Therefore, total paid for the $1200 is… $50 x 30.0 = $1500
Charging to a Credit Card and Not Paying It Off in Full Look at Wannemacher’s real statement… PV = $3503.95 expenses put on credit card I/Y = 13.24 / 12 = 1.1% monthly interest rate FV = 0 PMT = - $25 per month (my minimum payment) CPT [ N ] = Error 5 The “Minimum Payment” of $25 isn’t even enough to cover the Interest!! The balance would grow infinitely… What if I made a $50 per month payment… CPT [ N ] = 135.2 months Therefore, total paid for the $3503.95 is… $50 x 135.2 = $6,760.74
FICO Credit Score Components Source: www.myfico.com http://www.myfico.com/crediteducation/WhatsInYourScore.aspx AMOUNT OWED: o Revolving are more heavily weighted o %-age of credit limit borrowed (each card & total) LENGTH OF CREDIT HISTORY: o Time since accts opened o Time since acct activity NEW CREDIT: o Opening multiple new accts o Lenders checking your score 15% 10% 30% 10% 35% “CREDIT MIX”: o Vague o Mix of Revolving & Installment is good PAYMENT HISTORY: o Repayment of past debt: -- Revolving (“credit card”) -- Installment (“loans”) Credit Score (300 – 850) Assessments Source: www.easybadcreditrepair.com SCORE: ASSESSMENT: 750+ Excellent 720 - 749 Good 660 – 719 Fair 620 – 659 Uncertain Less than 620 Poor
CHAPTER 12 Financial Analysis and Long-Term Planning
Financial Management • Forms of Business Own’p • Sole Proprietorship • Partnership • Corporation Oprns ( Etc. ) Sales Finance Acctg • Statements • Income Statement • Balance Sheet • Statement of Cash Flows Financial Statements Capital Budgeting Ratio Analysis Long-Term Planning • Techniques • “Percentage of • Sales” • Cost-Volume-Profit • Stages • Identification * • Development * • Selection * • Implementation • Follow-up • Types • Liquidity • Asset Mgmt • Finl Leverage • Profitability • Market Value
Ratio Analysis CAUTION: A “Ratio” by itself is essentially worthless – it must be compared to another Ratio. Even then… BE CAREFUL! Categories of Ratio Analysis (1) (2) (3) “Trend” Or Time Series Analysis Industry Comparative Analysis Cross- Sectional Analysis * Compare to self from previous periods. * Compare to industry average. * Compare to other firms’ ratio.
Types of Financial Ratios (2) Asset Management Ratios (3) (1) Financial Leverage Ratios Liquidity Ratios Types Of Ratios (4) (5) Market Value Ratios Profitability Ratios * The first 4 use Income Stmt & Balance Sheet data. * The “Market Value Ratios” relates stock market info to financial statement items.