Download
1 / 43
430 likes | 433 Vues
V12 from graph connectivity to network flow. Program for today Menger‘s theorem Insert: annotate and compare functional annotations of genes Flow in networks. strict paths. Definition Let W be a set of vertices in a graph G and x another vertex not in W.

E N D
V12 from graph connectivity to network flow Program for today Menger‘s theorem Insert: annotate and compare functional annotations of genes Flow in networks Bioinformatics III
strict paths Definition Let W be a set of vertices in a graph G and x another vertex not in W. A strict x-W path is a path joining x to a vertex in W and containing no other vertex of W. A strict W-x path is the reverse of a strict x-W path (i.e. its sequence of vertices and edges is in reverse order). Example: Let us consider the u-v separating set W = {y,s,z} in the graph below. There are four strict u-W paths u,x,y, u,r,y, u,r,s, u,z And three strict W-v paths z,v, y,t,v, and s,v. Bioinformatics III
Menger’s Theorem Theorem 5.3.4 [Menger, 1927] Let u and v be distinct, non-adjacent vertices in a connected graph G. Then the maximum number of internally disjoint u-v paths in G equals the minimum number of vertices needed to separate u and v. Proof: The proof uses induction on the number of edges. The smallest graph that satisfies the premises of the theorem (non-adjacent u and v) is the path graph from u to v of length 2. The theorem is trivially true for this graph : one cut-vertex, one u-v path. u v Bioinformatics III
Menger’s Theorem Assume now that the theorem is true for all connected graphs having fewer than m edges, e.g. for some m ≥ 3. Suppose that G is a connected graph with m edges, and let k be the minimum number of vertices needed to separate the vertices u and v. By Corollary 5.3.2 (number of paths number of vertices), it suffices to show that there exist k internally disjoint u-v paths in G. This is clearly true if k = 1 (since G is connected, there exists a u-v path). Thus, we will assume k ≥ 2. Bioinformatics III
Proof of Menger’s Theorem Assertion 5.3.4a If G contains a u-v path of length 2, then G contains k internally disjoint u-v paths. Proof: Suppose that P = u,e1,x,e2,v is a path in G of length 2. G – x has fewer edges than G →by the induction hypothesis, there are at least k – 1 internally disjoint u – v paths in G – x. Path P is internally disjoint from any of these, and, hence, there are k internally disjoint u-v paths in G. □ If there is a u-v separating set that contains a vertex adjacent to both vertices u and v, then Assertion 5.3.4a guarantees the existence of k internally disjoint u-v paths in G. The argument for distance (u,v) ≥ 3 is now broken into two cases, according to the kinds of u-v separating sets that exist in G. Bioinformatics III
Proof of Menger’s Theorem In Case 1 (left picture), there exists a u-v separating set W, where neither u nor v is adjacent to every vertex of W . In Case 2 (right picture), no such separating set exists. Thus, in every u-v separating set for Case 2, either every vertex is adjacent to u or every vertex is adjacent to v. Bioinformatics III
Proof of Menger’s Theorem Case 1: There exists a u-v separating set W = {w1, w2, ... ,wk } of vertices in G of minimum size k, such that neither u nor v is adjacent to every vertex in W. Let Gube the subgraph induced on the union of the edge-sets of all strict u-W paths in G, and let Gv be the subgraph induced on the union of edge-sets of all strict W-v paths (see Fig. below). Split up graph Bioinformatics III
Proof of Menger’s Theorem Assertion 5.3.4b: Both of the subgraphs Guand Gvhave more than k edges. Proof : For each wi W, there is a u-v path Pwiin G on which wi is the only vertex of W. (Otherwise, W – {wi} would still be a u-v separating set, which would contradict the minimality of W). The u-wi subpath of Pwiis a strict u-W path that ends at wi. Thus, the final edge of this strict u-W path is different for each wi. Hence, Guhas at least k edges. The only way Gucould have exactly k edges would be if each of these Strict u-W paths consisted of a single edge joining u and wi, i = 1, ..., k. But this is ruled out by the condition for Case 1. Therefore, Guhas more than k edges. A similar argument shows that Gvalso has more than k edges. □ Bioinformatics III
Proof of Menger’s Theorem Assertion 5.3.4c: The subgraphs Guand Gvhave no edges in common. Proof of 5.3.4c: By way of contradiction, suppose that the subgraphs Guand Gvhave an edge e in common. By the definitions of Guand Gv, edge e would then be an edge of both a strict u-W path and a strict W-v path. Hence, at least one of the endpoints of e, say x, is not a vertex in the u-v separating set W (see Fig. below). This implies the existence of a u-v path in G-W, which contradicts the definition of W. □ Bioinformatics III
Proof of Menger’s Theorem We now define two auxiliary graphs Gu*and Gv*: Gu*is obtained from G by replacing the subgraph Gvwith a new vertex v* and drawing an edge from each vertex in W to v*, and Gv*is obtained by replacing Guwith a new vertex u* and drawing an edge from u*to each vertex in W (see Fig. below). Bioinformatics III
Proof of Menger’s Theorem Assertion 5.3.4d: Both of the auxiliary graphs Gu*and Gv*have fewer edges than G. Q: Why would this be useful? Proof of 5.3.4d: The following chain of inequalities shows that graph Gu*has fewer edges than G. since Gu Gv is a subgraph of G 5.3.4c 5.3.4b by the construction of Gu* A similar argument shows that Gv*also has fewer edges than G. □ By the construction of graphs Gu*and Gv*, every u-v* separating set in graph Gu*and every u*-v separating set in graph Gv*is a u-v separating set in graph G. Hence, the set W is a smallest u-v* separating set in Gu* and a smallest u*-v separating set in Gv*. Bioinformatics III
Proof of Menger’s Theorem Since Gu*and Gv* have fewer edges than G, the induction hypothesis implies the existence of two collections, Pu* and Pv* of k internally disjoint u-v* paths in Gu*and k internally disjoint u*-v paths in Gv*, respectively (see Fig.). For each wi, one of the paths in Pu* consists of a u-wi path Pi‘ in G plus the new edge from wito v*, and one of the paths in Pv* consists of the new edge from u*to wi followed by a wi-v path Pi‘‘ in G. Let Pi be the concatenation of paths Pi‘ and Pi‘‘, for i = 1, ..., k. Then the set {Pi} is a collection of k internally disjoint u-v paths in G. □ (Case 1) Bioinformatics III
Proof of Menger’s Theorem Case 2: Suppose that for each u-v separating set of size k, one of the vertices u or v is adjacent to all the vertices in that separating set. will not be proven in lecture Let P = u,e1,x1,e2,x2, ..., v be a shortest u-v path in G. By Assertion 5.3.4a, we can assume that P has length at least 3 and that vertex x1 is not adjacent to vertex v. By Proposition 5.1.3, the edge-deletion subgraph G – e2is connected. Let S be a smallest u-v separating set in subgraph G – e2 (see Fig.). Bioinformatics III
Proof of Menger’s Theorem Then S is a u-v separating set in the vertex-deletion subgraph G – x 1. Thus, S {x1} is a u-v separating set in G, which implies that | S | ≥ k – 1, by the minimality of k. On the other hand, the minimality of | S | in G – e2 implies that | S | ≤ k, since every u-v separating set in G is also a u-v separating set in G – e2. If | S | = k, then, by the induction hypothesis, there are k internally disjoint u-v paths in G – e2 and, hence, in G. If | S | = k – 1, then xi S, i = 1,2 (otherwise S – {xi } would be a u-v separating set in G – e2, contradicting the minimality of k). Thus, the sets S {x1} and S {x2}are both of size k and both u-v separating sets of G. The condition for Case 2 and the fact that vertex x1 is not adjacent to v imply that every vertex in S is adjacent to vertex u. Hence, no vertex in S is adjacent to v (lest there be a u-v path of length 2). But then the condition of Case applied to S { x2 } implies that vertex x2 is adjacent to vertex u, which contradicts the minimality of path P and completes the proof. □ Bioinformatics III
Insert: functional annotation of gene function • Functional annotation of genes/gene products: Gene Ontology (GO) • significance of annotation: hypergeometric test • (mathematical) similarity of GO-terms See lecture V3 page 20. There we stated 3) co-functionality it is realistic to assume that members of a protein complex should have closely related biological functions -> check whether interaction proteins have overlapping annotations with terms from Genome Ontology (GO) Equivalently, we can expect that members of a protein complex should have higher functional similarity to eachother than random proteins. Bioinformatics III
The Gene Ontology (GO) Ontologies are structured vocabularies. The Gene Ontology consists of 3 trees: - Biological process (BP) - molecular function (MF) - cellular component (localisation). Shown here is a part of the BP tree. At the top: most general term (root) Red: tree leafs (very specific GO terms) Green: common ancestor Blue: other nodes. Arcs: „Y is contained in X“-relations PhD Dissertation Andreas Schlicker (UdS, 2010) Bioinformatics III
Where do the Gene Ontology annotations come from? Rhee et al. Nature Reviews Genetics 9, 509-515 (2008) Bioinformatics III
Signifkance of GO annotations Very general GO terms such as “cellular metabolic process“ are annotated to many genes in the genome. Very specific terms belong to a few genes only. → One needs to compare howsignificant the occurrence of a GO term is in a given set of genes compared to a randomly selected set of genes of the same size. This is often done with the hypergeometric test. PhD Dissertation Andreas Schlicker (UdS, 2010) Bioinformatics III
Hypergeometric test The hypergeometric test is a statistical test. It can be used to check e.g. whether a biological annotation π is statistically significant enriched in a given test set of genes compared to the full genome. ▪ N : number of genes in the genome ▪ n : number of genes in the test set ▪ Kπ : number of genes in the genome with annotation π. ▪ kπ : number of genes in test set with annotation π. The hypergeometric test provides the likelihood that kπ or more genes that were randomly selected from the genome also have annotation π. p-value = http://great.stanford.edu/ Bioinformatics III
Hypergeometric test Select i ≥ kπ genes with annotation π from the genome. There are Kπ such genes. The other n – i genes in the test set do NOT have annotation π. There are N – Kπ such genes in the genome. p-value = corrects for the number of possibilities for selecting n elements from a set of N elements. This correction is applied if the sequence of drawing the elements is not important. The sum runs from kπ elements to the maximal possible number of elements. This is either the number of genes with annotation π in the genome (Kπ) or the number of genes in the test set (n). http://great.stanford.edu/ http://www.schule-bw.de/ Bioinformatics III
Example p-Wert = Is annotation π significantly enriched in the test set of 3 genes? Yes! p = 0.05 is (just) significant. http://great.stanford.edu/ Bioinformatics III
Information content of GO terms The likelihood of a node t can be defined in 2 ways: How many genes have annotation t Number of GO terms in subtree below t relative to the root node? relative to number of GO terms in tree . The likelihood takes values between 0 and 1 and increases monotonic from the leaf nodes to the root. Define information content of a node from its likelihood: A rare node has high information content. PhD Dissertation Andreas Schlicker (UdS, 2010) Bioinformatics III
Common ancestors of GO terms Common ancestors of two nodes t1 and t2 : all nodes that are located on a path from t1 to root AND on a path from t2 to root. The most informative common ancestor (MICA) of terms t1 und t2 is their common ancestor with highest information content. Typically, this is the closest common ancestor. Nucl. Acids Res. (2012) 40 (D1): D559-D564 Bioinformatics III
Measure functional similarity of GO terms Schlicker et al. defined the similarity of two GO terms t1 und t2 based on the information content of the most informative common ancestor (MICA) The following variant worked slightly better in practice: PhD Dissertation Andreas Schlicker (UdS, 2010) Bioinformatics III
Measure functional similarity of two genes Two genes or two sets of genes A und B typically have more than 1 GO annotation each. → Consider similarity of all terms i and j: and select the maxima in all rows and columns: Compute funsim-Score from scores for BP tree and MF tree: PhD Dissertation Andreas Schlicker (UdS, 2010) Bioinformatics III
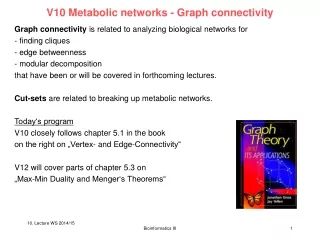
Flows and Cuts in Networks The second part of this lecture follows closely chapter 12.1 in the book on the right on „Flows and Cuts in Networks and Chapter 12.2 on “Solving the Maximum-Flow Problem“ Flowin Networks can mean - flow of oil or water in pipelines, electricity - phone calls, emails, traffic networks ... Equivalences exist between max-flow min-cut theorem of Ford and Fulkerson & the connectivity theorems of Menger this led to the development of efficient algorithms for a number of practical problems to solve scheduling and assignment problems. Bioinformatics III
Single Source – Single Sink Capacitated Networks Definition: A single source – single sink network is a connected digraph that has a distinguished vertex called the source with nonzero outdegree and a distinguished vertex called the sink with nonzero indegree. Such a network with source s and sink t is often referred to as a s-t network. Definition: A capacitated network is a connected digraph such that each arc e is assigned a nonnegative weight cap(e),called the capacity of arc e. Notation: Let v be a vertex in a digraph N. Then Out(v)denotes the set of all arcs that are directed away from vertex v. That is, Correspondingly, In(v)denotes the set of arcs that are directed to vertex v: Bioinformatics III
Single Source – Single Sink Capacitated Networks Notation: For any two vertex subsets X and Y of a digraph N, let X,Ydenote the set of arcs in N that are directed from a vertex in X to a vertex in Y. Example: The figure shows a 5-vertex capacitated s-t-network. If X = {x,v} and Y = {w,t}, then the elements of arc set X,Y are the arc directed from vertex x to vertex w and the arc directed from vertex v to sink t. The only element in arc set Y,Xis the arc directed from vertex w to vertex v. A 5-vertex capacitated network with source s and sink t. Bioinformatics III
Feasible Flows • Definition: Let N be a capacitated s-t-network. • A feasible flowf in N is a function f:EN R+that assigns a nonnegative real number to every vertex v in network N, other than source s and sink t, and that fulfills the following two conditions • (capacity constraints) f(e) cap(e), for every arc e in network N. • (conservation constraints) Property 2 above is called the conservation-of-flow condition. E.g. for an oil pipeline, the total flow of oil going into any juncture (vertex) in the pipeline must equal the total flow leaving that juncture. Notation: to distinguish visually between the flow and the capacity of an arc, we adopt the convention in drawings that when both numbers appear, the capacity will always be in bold and to the left of the flow. Bioinformatics III
Feasible Flows Example: The figure shows a feasible flow for the previous network. Notice that the total amount of flow leaving source s equals 6, which is also the net flow entering sink t. Definition: The value of flowf in a capacitated network N, denoted with val(f), is the net flow leaving the source s, that is Definition: The maximum flowf* in a capacitated network N is a flow in N having the maximum value, i.e. val(f) val(f*), for every flow f in N. Bioinformatics III
Cuts in s-t Networks By definition, any nonzero flow must use at least one of the arcs in Out(s). In other words, if all of the arcs in Out(s) were deleted from network N, then no flow could get from source s to sink t. This is a special case of the following definition, which combines the concepts of partition-cut and s-t separating set. From V11 Definition: Let G be a graph, and let X1 and X2 form a partition of VG. The set of all edges of G having one endpoint in X1 and the other endpoint in X2 is called a partition-cut of G and is denoted X1,X2. From V11 Definition: Let u and v be distinct vertices in a connected graph G. A vertex subset (or edge subset) S is u-v separating (or separates u and v), if the vertices u and v lie in different components of the deletion subgraph G – S. Bioinformatics III
Cuts in s-t Networks Definition: Let N be an s-t network, and let Vsand Vt form a partition of VG such that source s Vsand sink t Vt. Then the set of all arcs that are directed from a vertex in set Vsto a vertex in set Vt is called an s-t cut of network N and is denoted Vs,Vt. Remark: The arc set Out(s)for an s-t network N is the s-t cut {s},VN – {s}, and In(t) is the s-t cut VN – {t},{t}. Bioinformatics III
Cuts in s-t Networks Example. The figure portrays the arc sets Out(s) and In(t) as s-t cuts, where Out(s) = {s}, {x,v,w,t} and In(t) = {s,x,v,w},{t} . Example: a more general s-t cut Vs,Vt is shown below, where Vs = {s,x,v} and Vt = {w,t}. Bioinformatics III
Cuts in s-t Networks Proposition 12.1.1 Let Vs,Vt be an s-t cut of a network N. Then every directed s-t path in N contains at least one arc in Vs,Vt . Proof. Let P = s = v0,v1,v2, …,vl = t be the vertex sequence of a directed s-t path in network N. Since s Vsand t Vt, there must be a first vertex vj on this path that is in set Vt (see figure below). Then the arc from vertex vj-1 to vjis in Vs,Vt .□ Bioinformatics III
Relationship between Flows and Cuts • Similar to viewing the set Out(s) of arcs directed from source s as the s-t cut • {s}, VN – {s} , the set In(s) may be regarded as the set of „backward“ arcs relative to this cut, namely, the arc set VN – {s}, {s}, . • From this perspective, the definition of val(f) may be rewritten as Bioinformatics III
Relationship between Flows and Cuts Lemma 12.1.2. Let Vs,Vt be any s-t cut of an s-t network N. Then Proof: For any vertex v Vs, each arc directed from v is either in Vs,Vs or in Vs,Vt. The figure illustrates for a vertex v the partition of Out(v) into a 4-element subset of Vs,Vs and a 3-element subset of Vs,Vt. Similarly, each arc directed to vertex v is either in Vs,Vs or in Vt,Vs . □ Bioinformatics III
Relationship between Flows and Cuts Proposition 12.1.3. Let f be a flow in an s-t network N, and let Vs,Vt be any s-t cut of N. Then Proof: By definition, And by the conservation of flow (1) By Lemma 12.1.2. (2) Now enter the right hand sides of (2) into (1) and obtain the desired equality.□ Bioinformatics III
Example The flow f and cut {s,x,v},{w,t}shown in the figure illustrate Proposition 12.1.3. The next corollary confirms something that was apparent from intuition: the net flow out of the source s equals the net flow into the sink t. Corollary 12.1.4 Let f be a flow in an s-t network. Then Proof: Apply proposition 12.1.3 to the s-t cut In(t) = VN – {t}, {t} .□ Bioinformatics III
Example Definition. The capacity of a cutVs,Vt denoted capVs,Vt, is the sum of the capacities of the arcs in cut Vs,Vt. That is Definition. The minimum cut of a network N is a cut with the minimum capacity. Example. The capacity of the cut shown in the previous figure is 13, And the cut {s,x,v,w},{t} with capacity 10, is the only minimum cut. Bioinformatics III
Maximum-Flow and Minimum-Cut Problems The problems of finding the maximum flow in a capacitated network N and finding a minimum cut in N are closely related. These two optimization problems form a max-min pair. The following proposition provides an upper bound for the maximum-flow problem. Bioinformatics III
Maximum-Flow and Minimum-Cut Problems Proposition 12.1.5 Let f be any flow in an s-t network, and let Vs,Vt be any s-t cut. Then Proof: □ Bioinformatics III
Maximum-Flow and Minimum-Cut Problems Corollary 12.1.6 (Weak Duality) Let f* be a maximum flow in an s-t network N, and let K* be a minimum s-t cut in N. Then Proof: This follows immediately from proposition 12.1.5. Corollary 12.1.7 (Certificate of Optimality) Let f be a flow in an s-t network N and K an s-t cut, and suppose that val(f) = cap(K). Then flow f is a maximum flow in network N, and cut K is a minimum cut. Proof: Let f‘ be any feasible flow in network N. Proposition 12.1.5 and the premise give → f is a maximum flow On the other hand, let Vs,Vt be any s-t cut. Proposition 12.1.5: → K is a minimum cut.□ Bioinformatics III
Example Example The flow for the example network shown in the figure has value 10, which is also the capacity of the s-t cut {s,x,v,w},{t}. By corollary 12.1.7, both the flow and the cut are optimal for their respective problem. A maximum flow and minimum cut. Corollary 12.1.8 Let Vs,Vt be an s-t cut in a network N, and suppose that f is a flow such that Then f is a maximum flow in N, and Vs,Vt is a minimum cut. Bioinformatics III