Download
1 / 24
240 likes | 351 Vues
Earth Observation data as integrator tool in a town planning agency. Hélène de Boissezon, Maylis Galaup, Stéphane Dupuy SCOT Services et Conception de systèmes en Observation de la Terre Ramonville, France. General background on geographical data managed by cities.

E N D
Earth Observation data as integrator tool in a town planning agency Hélène de Boissezon, Maylis Galaup, Stéphane Dupuy SCOT Services et Conception de systèmes en Observation de la Terre Ramonville, France
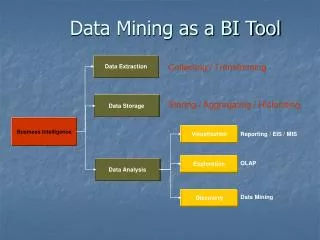
General background on geographical data managed by cities Three main levels in urban information systems Thematic layer 1:25 000 to 1:10 000 Strategic Urbanism document 1:5 000 Tactical Basic maps 1:2 000 to 1: 500 Technical • ”Technical” and “Tactical” levels are well defined in urban GIS • technical data, cadastral data, aerial photographs • Creation of data at ”Strategic” level often require heavy processing • aggregation and generalisation of technical data • problems of heterogeneity • New opportunities with the arrival of VHR satellite images
Description of tasks managed by cities Five main domains in urban information system • cadastral data, patrimony and public service management • risk analysis • measures for limiting pollution TERRITORIAL MANAGEMENT ENVIRONMENTAL MANAGEMENT URBAN PLANNING TRANSPORTATION MANAGEMENT EQUIPMENT AND INFRASTRUCTURE MAINTENANCE • traffic optimisation • real-time control • networks facilities maintenance • land use planning
Potential utilisation of EO data • Two domains of activity demand more tactical or strategic data with important needs in • global, regular, historical geographical information, • information processes able of mixing statistical and geographical data, and modelling evolutions • environmental management urban planning • Particular use of GPS data for traffic control • Potential use of EO data for the whole information system • integrating role • communication medium
Urban planning in France • Urban planning • methods used to influence future geographical distribution of activities on territory, for more rational land use organisation • more and more complex task, with increasing responsibilities • work performed at regional scale, not only city level • New territory management law (LOADDT) • association of economic/social, urban/rural areas in sustainable way • redefinition of local authorities territories • only three regrouped administrative units : community of municipalities, community of agglomeration, urban community • Increasing work at “community” level, and not only “city” level
Practical study on Toulouse agglomeration Increasing requirements in global geographic informationin the local town planning agency (AUAT) Requirements for geographic information at STRATEGIC levelfor Master Plan revision, environmental studies, “Territorial Coherence Scheme” and “Regional Schemes of Territory Management” (LOADDT). Main problems encountered, solutions brought by EO Large area of interest: 40 x 40 km², with 60 municipalities Land use data are frequently not self-consistent, not regularly updated Zoning documents integrate regulation information, actual and planned land cover/land use Aerial photographs do not cover the whole AUAT territory EO data should provide exhaustive updated land cover information
Input data For answering town planning agency needsat STRATEGIC level The most precise EO data commercially available in 1999 have been used : IRS 1C Panchromatic image at 5m resolution Spot Xi Multispectral image at 20 m resolution Merging of data for getting multispectral image at 5m resolution For analysing city council requirements at STRATEGIC level Simulations of future Spot5 images have been used : Spot5 THR Panchromatic at 2.5 m resolution Spot5 XS Multispectral at 10 m resolution Merging of data for getting multispectral image at 2.5 m
Selection of satellite images Panchromatic IRS Image 5 m resolution Black and White date: 20th March 99 Advantages : good precision allowing restitution at 25.000e full image:70x70 km² illustration scale : around 75.000 e
Selection of satellite images SPOT Xi image 20 m resolution 4 channels: G, R, PIR, MIR date : 20th March 99 Advantages : very good radiometric information allowing automatic classification full image 60x60 km² illustration scale : around 75.000 e
Simulation of future VHR satellite image SPOT 5 THR image 2.5 m resolution in panchromatic channel Advantages : very good geometric precision full image 60x60 km² illustration scale: 5.000e
Simulation of future VHR satellite image SPOT 5 THR+XS image 2.5 m resolution in panchromatic channel merged with 10 m resolution in multispectral channels Advantages : very good geometric precision and radiometric information allowing automatic classification full image 60x60 km² illustration scale: 5.000e
Technical work performed on satellite images • Main technical orientations for image processing in the pilot project • production of information about land occupation, self consistent with definitions and nomenclatures used by AUAT • targeted scales : 1:10.000 mainly, and 1:25.000 • working area covering the whole area of interest of AUAT (40x40km²) • priority to automatic image processing for reliable, reproducible, rapid and cost-effective methods and products • regular evaluation and feed-back on results by AUAT and Toulouse City Council
Technical work performed on satellite images Pre-processing: Geometric correction of Spot Xi and IRS Pan images (Lambert 3 projection) Merging of images Pan and Xi creation of Pan+Xi image with 4 channels, 5 m resolution Creation of “Natural colours image” : Creation of artificial Blue channel by linear combination of Green and Near Infra Red channels image similar to an aerial photograph
Product « Natural colour image » IRS+Spot image in natural colours Scale 1:25.000 5 m resolution 4 channels : G, R, NIR, MIR projection: Lambert 3 Advantage : - easy interpretation by non skilled users - large coverage - fully operational Professional use: - decision making at strategic level - communication tool for Master Plans, urban projects illustration size :42 x 42 km²
Creation of the « Physical land occupation map » Calculation of parameters characterising urban structures texture : characterisation of urban structures variance : extraction of large buildings with strong reflectance Segmentation and classification of image identification of homogeneous regions of the image (radiometry, texture and variance) classification of regions into 25 initial radiometric classes Characterisation of classes manual regrouping into 7 land occupation classes Quality control and manual corrections suppression of some radiometric confusions such as : light bare soils and urban areas, commercial buildings roofs and bare soils, building sites and urban areas, ...
Product « Physical land occupation map » • Information layer • « physical land occupation map » • at 25.000e scale • The 7 final classes • built-up areas : light pink • large buildings : red • individual houses : purple • woods : dark green • vegetation : yellow • bare soils : brown • water : blue • Professional use: • Minor interest for users (nomenclature not compatible) • illustration scale 1:75.000
Creation of derived information plans by aggregation Method zoning by aggregating entities with inter-distance criterion use of GIS functions (positive et negative buffers ) entirely automatic processing applied to the “physical land occupation” layer Creation of the « Agglomerated urban areas » application of 200 meters distance to built-up areas (Eurostat and INSEE criterion) delimitation of Toulouse urban physical agglomeration Creation of the « Aggregated vegetation areas » selection of vegetated areas with surface greater than 0.5 ha application of 50 meters distance to vegetation areas delimitation of the green areas on Toulouse agglomeration
Product « Agglomerated urban areas » Derived information layer «agglomerated urban areas» at 25.000e scale in pink : actual physical extent of the urban agglomeration Advantages: - single zoningshowing physical extent of agglomeration at a given date - can be adapted to other towns Professional use: - comparison of planned / actual housing (Master Plan revision) illustration scale: 200.000e
Product « Agglomerated urban areas » Derived information layer «agglomerated urban areas» at 25.000e scale in pink : actual physical extent of the urban agglomeration Advantages: - single zoningshowing physical extent of agglomeration at a given date - can be adapted to other towns Professional use: - comparison of planned / actual housing (Master Plan revision) illustration scale: 200.000e
Product « Aggregated vegetation areas » Derived information layer « aggregated vegetation areas » at 25.000e scale in green : actual extent of the green areas and woods Advantages: - mapping of all vegetation areas (private and public) - identification of continuous green areas(“green belt”) Professional use: - living environment studies - comparison of planned / actual green areas (Master Plan revision) illustration scale: 200.000e
Technical work performed on simulated Spot5 images Pre-processing and processing steps : the same as for satellite image Pre-processing (geometry, merging of 2.5 m and 10m resolutions) Creation of “Natural colours image” Calculation of parameters characterising urban structures Segmentation and classification of image creation of the physical land occupation map Remark : results similar with classification per pixel
Creation of derived information plans on census block basis Method for census blocks characterisation Crossing of land occupation and census blocks Calculation of statistical parameters per block (major class, % of classes, etc.)
Product « Characterisation of urban blocks » Characterization of land occupation per block at 10.000e the color of the block indicates the percentage of artificial area Advantages: - mapping of land occupation inside blocks, either private and public - identification of sealed/unsealed areas -information reproducible each year Professional use: - water runoff studies - environmental studies - living environment studies
Conclusion and perspectives Better access to VHR satellite images in the near future Two critical issues: automatic processing will it be possible? sufficient geographical coverage (swath) ? Conditions of success for VHR satellite images EO data must not be considered as final product Easy and efficient integration into urban and regional data bases: communication medium integrator tool spatialisation of statistics corroboration of other data