Download

1 / 22
220 likes | 355 Vues
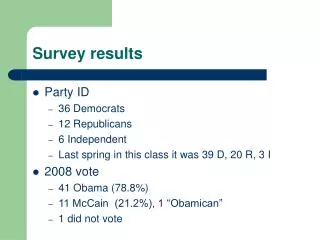
Triangle Survey Results. Collected July-September 2016. Resident Confidence Survey. Random Sampling & Data Integrity 200 responses! Most surveys completed door-to-door Also used email, paper mail, and a web address Two of the best volunteers: Jon and Aggie!. Why are neighbors satisfied…?.

E N D
Triangle Survey Results Collected July-September 2016
Resident Confidence Survey • Random Sampling & Data Integrity • 200 responses! • Most surveys completed door-to-door • Also used email, paper mail, and a web address • Two of the best volunteers: Jon and Aggie!
In the past 3 years, these things have contributed to neighborhood change and/or stability…
And in the next three years, these things will determine the future of the neighborhood…
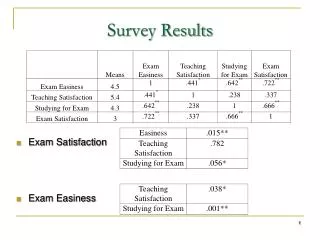
General levels of satisfaction remain similar, but more people selected “N/A”
Fire department and ambulance response remain strong, but snow and street services continue to deteriorate in quality. Trash collection is strong throughout the neighborhood
How can citizens demand better snow removal, especially for side streets?
Renters & Owners • Of the 30% of respondents who rent: • 81% would buy in the neighborhood • 19% would not buy in the neighborhood • Reasons those who wouldnot buy feel that way: • 4 aren’t interested in being homeowners (36%) • 7 cite crime or safety issues, desire to purchase in the suburbs, or are already moving (64%) • Reasons those who wouldbuy have not yet: • Over half say the main reason is financial/economic (53%) • The rest are mixed: trying to buy already (12%), not ready to buy yet (6%), crime/safety (6%), schools (4%), housing stock (4%), and other reasons (15%)
Property & Block Conditions • Based on observation (101 blocks and 91 properties) • Parcels in “good condition” needing no repairs increased from 29% to 41% • Houses that needed at least one, obvious major repair went down from 20% to 11%... • …but houses that were dilapidated and in need of comprehensive renovation increased from 0 to 4% • Properties where the owner or tenant showed a great amount of house-pride rose from 36% to 45% • Vacancies increased both in residential and commercial spaces
Discussion • Do you see the neighborhood “staying the same” as a good thing, or a bad thing, and why? • How can the neighborhood come together so that everyone is represented? • Block or street groups • Project-centered task forces • What additional challenges does your part of the neighborhood face?