Download
1 / 52
520 likes | 526 Vues
This session aims to introduce the techniques of sub-bottom data acquisition and interpretation, highlighting their importance in sea-floor exploration. The principles of sub-bottom profiling, including reflection coefficients and traces, will be covered, along with case studies using 2D and 3D seismic reflection profiling. The session will also explore different types of sub-bottom profilers, such as pingers and chirp systems.

E N D
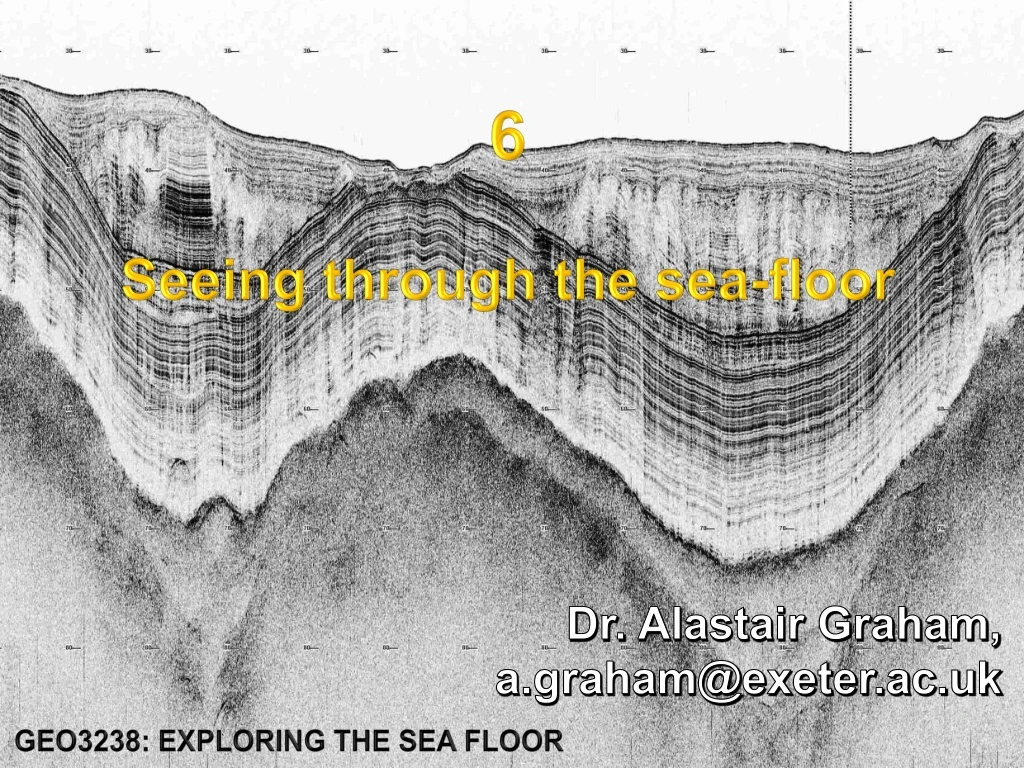
6 Seeing through the sea-floor Dr. Alastair Graham, a.graham@exeter.ac.uk GEO3238: EXPLORING THE SEA FLOOR
Last time • Developed some aspects of the theory and practice of multibeam acquisition and processing, which is fundamental for a hydrographer or anyone interested in the science of sea-floor surveying. • Used the practical last Friday to explore different aspects of the Earth sea floor and become acquainted with Geomapapp – a tool for investigating and analysing bathymetry GEO3238: EXPLORING THE SEA FLOOR Introduction
This week GEO3238: EXPLORING THE SEA FLOOR Introduction
Purpose of the session • (1) To introduce you to the different techniques of sub-bottom data acquisition • (2) To outline some commonly used interpretation approaches for sub-bottom datasets • (3) To illustrate both of these through some applied and useful case studies • Sub-bottom data form an integral part of sea-floor exploration. Rarely are bathymetry data used in isolation, so it is important to feel comfortable seeing and working with sub-bottom geophysical information. GEO3238: EXPLORING THE SEA FLOOR Introduction
Outline • Sub-bottom principles • Brief overview • Sub-bottom profilers • Types and theory • Interpretation techniques • Case studies • 2D seismic reflection profiling • Theory • Interpretation techniques • Case studies • 3D seismic data • Interpretation: timeslice and horizon analysis • Case studies GEO3238: EXPLORING THE SEA FLOOR Introduction
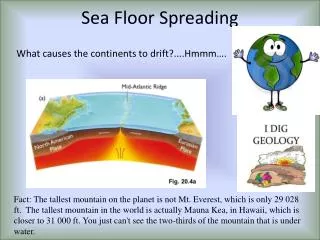
1. Sub-bottom principles • Build heavily on the ideas from previous lectures • Fundamentals same for acoustic & seismic methods TIME DEPTH Receiver Source Receiver response t=0 Velocity T = 2 x depth velocity Depth Reflector Reflection time • Source and receiver always separate in seismic survey GEO3238: EXPLORING THE SEA FLOOR 1. Sub-bottom principles
The ideal scenario • We want a geophysical representation of geological beds, only a few metres thick, buried under the sea floor GEO3238: EXPLORING THE SEA FLOOR 1. Sub-bottom principles
Reflections • The boundaries between sediment or rock beds imaged by sound (acoustic or seismic) methods • Peaks or troughs in reflected wave GEO3238: EXPLORING THE SEA FLOOR 1. Sub-bottom principles
What causes reflections? Acoustic record Source Receiver • Any interface between bodies with different acoustic properties • Acoustic properties define Impedance (I): • I = velocity * density • Small change in impedance – small reflection • Large change in impedance – large reflection Wet bulk density and compressional wave velocity Layer 1 --- V1 * ρ1 Layer 2 --- V2 * ρ2 GEO3238: EXPLORING THE SEA FLOOR 1. Sub-bottom principles
What will produce a stronger reflection? • A water interface with dry sand • OR • A water interface with Basalt GEO3238: EXPLORING THE SEA FLOOR 1. Sub-bottom principles
Reflection coefficient • R = (ρ2V2 − ρ1V1) / (ρ2V2 + ρ1V1), • Where: • R = reflection coefficient, whose values range from −1 to +1ρ1 = density of medium 1ρ2 = density of medium 2V1 = velocity of medium 1V2 = velocity of medium 2 • Proportion of the seismic wave amplitude reflected from an interface relative to the wave amplitude incident upon it • Determines polarity and strength of the reflected energy GEO3238: EXPLORING THE SEA FLOOR 1. Sub-bottom principles
Traces and sections • A representation of the response of the wavefield to velocity and density contrasts within rock or sediment as the energy travels from source to receiver GEO3238: EXPLORING THE SEA FLOOR 1. Sub-bottom principles
2. Sub-bottom profilers RV Marion Dufresne GEO3238: EXPLORING THE SEA FLOOR 2. Sub-bottom profilers
Sub-bottom profilers • Sub-bottom profiling systems comprise a sound source, either towed behind a vessel or mounted to the hull, that produces an acoustic pulse of set frequency, power, and time duration. • Operate in the same way as SBES • Use lower frequencies to penetrate sediment layers beneath the sediment-water interface • Use higher output energy • Rely on reflections from the sediment sequence to identify and measure sediment layers • Different types: • Pingers • Chirp • Parametric GEO3238: EXPLORING THE SEA FLOOR 2. Sub-bottom profilers
Basic theory for all sub-bottom profilers Increasing penetration depth • 1- 20 kHz range, but 3.5 kHz most common • Best results when angle of incidence near-vertical to the sea floor • Direct echo is stronger than at oblique angles • Rugged and rough terrain harder to image • Penetration varies: • None in rock • 1-10s m in harder, mixed sediments • 100 m in low-absorbing soft sediments GEO3238: EXPLORING THE SEA FLOOR 2. Sub-bottom profilers
Parametric sub-bottom profiler • transmits two signals of slightly different high frequencies (e.g. 100 and 110 kHz). • Interaction generates, by interference, a new low-frequency signal (the difference frequency here is 10 kHz). • Narrow beam • Short pulse so very high vertical resolution • Penetration ~50 m • Useful for imaging discrete features because of the small footprint; e.g. pipelines, shipwrecks Example of Kongsberg TOPAS data from offshore Norway GEO3238: EXPLORING THE SEA FLOOR 2. Sub-bottom profilers
Chirp sub-bottom profiling • Chirp systems are so named due to their emission of a chirp sound (rather than a ping) for a single frequency unit • Sweeps through a range of frequencies • Shorter pulse allows imaging of finer structure (but longer pulse = more power) • Can produce very high resolution profiles in soft sediments (up to ~5cm and to ~100 m depth) • Complex signal processing GEO3238: EXPLORING THE SEA FLOOR 2. Sub-bottom profilers
Chirp sub-bottom profiling • Chirp systems are so named due to their emission of a chirp sound (rather than a ping) for a single frequency unit • Sweeps through a range of frequencies • Can produce very high resolution profiles in soft sediments (up to ~5cm and to ~100 m depth) • Complex signal processing High resolution (10 cm) but also good penetration GEO3238: EXPLORING THE SEA FLOOR 2. Sub-bottom profilers
Comparison of pinger and chirp type data Illustrates that pulse length (power) and frequencies important for resolution and imaging depth GEO3238: EXPLORING THE SEA FLOOR 2. Sub-bottom profilers
Interpretation of sub-bottom profiler data • Acoustic facies analysis • The physical properties of the seabed (eg sediment bulk density, grainsize) can be approximated from analysis of the acoustic reflection response. • Much information can be gained through the analysis of sub-surface reflectors, and the thickness and geometry of sedimentary units GEO3238: EXPLORING THE SEA FLOOR 2. Sub-bottom profilers
Damuth (1980) classification • Since the 1960’s, 3.5 kHz systems used widely • Damuth (1980) developed surface sediment classification system for 3.5 kHz echograms. • The simple echo characteristics of the sea floor may be classified into categories, based on the following parameters/characteristics: • clarity of reflectors (beneath the sea floor) • continuity of reflectors • Geometry of sub-bottom reflectors • qualitative relationship w/ seafloor morphology (roughness, hyperbolic returns) • Echo-character maps constructed by developing classification system specific to a study area. • Amplitude 2. Sub-bottom profilers
Damuth (1980) GEO3238: EXPLORING THE SEA FLOOR Intro- Pt 1 - Pt 2 - Pt 3 - Pt 4
The early days: not much to work with Current-eroded sea bed in 250 m water depth at the crest of Charleston Bump, South Carolina GEO3238: EXPLORING THE SEA FLOOR 2. Sub-bottom profilers
Case study 1 • Dowdeswell et al. (2014) • Acoustic facies along a 400 km shelf-slope system, West of Greenland • TOPAS parametric source GEO3238: EXPLORING THE SEA FLOOR Intro- Pt 1 - Pt 2 - Pt 3 - Pt 4
Case study 1 • Dowdeswell et al. (2014) • Acoustic facies along a 400 km shelf-slope system, West of Greenland GEO3238: EXPLORING THE SEA FLOOR Intro- Pt 1 - Pt 2 - Pt 3 - Pt 4
Case study 2 • Canals et al. (1998) • Antarctic Pen drifts – parametric survey • Some early drift observations • Sediment failures • Argued for little drift growth in recent times GEO3238: EXPLORING THE SEA FLOOR Intro- Pt 1 - Pt 2 - Pt 3 - Pt 4
Case study 3 • Davies et al. (2017; JGR Earth Surface) • AUV sub-bottom chirp beneath Pine Island Ice Shelf • ‘inaccessible’ environment • Sea-floor sediments of recent ice retreat • Possible grounding zone wedges under the ice shelf GEO3238: EXPLORING THE SEA FLOOR 2. Sub-bottom profilers
Take a 10 minute break GEO3238: EXPLORING THE SEA FLOOR
3. 2D seismic reflection survey • Mechanically generated sound waves • Airgun(s) as source of sound • Compressed air to make a ‘shockwave’ • Long ‘streamer’ of towed hydrophones record the reflected energy GEO3238: EXPLORING THE SEA FLOOR 3. 2D seismic survey
Airgun shots • Airgun produces ‘shots’ • Fired at a constant interval/spacing • Can produce frequencies <10 Hz • Very low frequency means far superior penetration than SBP • Trade off with resolution • Arrays of guns used to improve power and signal GEO3238: EXPLORING THE SEA FLOOR 3. 2D seismic survey
GEO3238: EXPLORING THE SEA FLOOR Intro- Pt 1 - Pt 2 - Pt 3 - Pt 4 3. 2D seismic survey
Seismic principles • As discussed at start of the day 3. 2D seismic survey
Common Midpoint Gather • Instead of just one trace at sea floor location, acquire series of traces at the common sub-surface midpoint. • Fold ‘sampling’ increases imaging ability GEO3238: EXPLORING THE SEA FLOOR 3. 2D seismic survey
Stacking • Summing of the traces • Boosts signal to noise ratio • Takes into account offsets of all the sources/receivers GEO3238: EXPLORING THE SEA FLOOR 3. 2D seismic survey
Single vs multi-channel 2D seismic • Single channel • One gun, one receiver; shallow depth and high frequency • Can obtain high resolution, shallow penetration • Multi-channel • Long streamer, many hydrophones, each recording same shot and reflection events • Big airgun arrays capable of imaging many kilometres depth • Lower frequencies, lower resolution GEO3238: EXPLORING THE SEA FLOOR 3. 2D seismic survey
Straight lines • Very precise geometries needed • Good understanding of the sediment velocities Seismic survey approach GEO3238: EXPLORING THE SEA FLOOR 3. 2D seismic survey
Interpretation of seismic data - 1 • Seismic Facies Unit – a mappable, three dimensional seismic unit composed of groups of reflections whose parameters differ from those of adjacent facies units • Seismic Facies Analysis – is the description and geologic interpretation (environmental setting, lithofacies, etc.) of seismic reflection parameters GEO3238: EXPLORING THE SEA FLOOR 3. 2D seismic survey
Interpretation steps • Seismic sequence analysis to map sequence boundaries using reflection geometry and terminations • subdivides the sediment record into genetically related units – depositional sequences • Seismic facies analysis • Captures geometric information for each unit • Studies seismic attributes (e.g. reflection amplitude/continuity) • Combine to interpret environment of deposition GEO3238: EXPLORING THE SEA FLOOR 3. 2D seismic survey
Reflection geometries • Reflection patterns and configuration descriptors • Used to interpret depositional environment • e.g. ‘Chaotic’ seismic units tell us something about the sediment type Stoker, 1997 GEO3238: EXPLORING THE SEA FLOOR 3. 2D seismic survey
Geometry mapping approach – The ABC method • A: Above, B: Below, C: Centre • A: termination at upper sequence boundary • B: termination at lower sequence boundary • C: internal reflection patterns GEO3238: EXPLORING THE SEA FLOOR 3. 2D seismic survey
Interpretation of seismic data - 2 • Isopach maps • 2D to 3D transfer of information • Depositional centres • Volumes of sediment • Migration processes on continental margins Nice paper showing the evolution of Drift 7 using seismic data on the Antarctic Peninsula Uenzelmann-Neben, 2006; Mar Geol GEO3238: EXPLORING THE SEA FLOOR 3. 2D seismic survey
Case study Andreassen, 2017; Science • Combined bathymetry, seismic, and water column study showing sea-floor craters and mounds in the Arctic • Subglacial gas hydrates sequester from natural sources to create ‘pingos’. • Upon ice retreat they destabilise and expel methane forming craters GEO3238: EXPLORING THE SEA FLOOR 3. 2D seismic survey
4. 3D seismic reflection surveying • Expensive survey technique • Hydrocarbon industry • Academic uses • Generates ‘cube’ of data for analysis GEO3238: EXPLORING THE SEA FLOOR 4. 3D seismic survey
Timeslices • Cut the dataset horizontally • Step up and down through stratigraphy GEO3238: EXPLORING THE SEA FLOOR 4. 3D seismic survey
3D Horizon mapping • Horizon: the surface separating two sediment or rock layers; manual and automated mapping methods GEO3238: EXPLORING THE SEA FLOOR 4. 3D seismic survey
Attribute mapping • Extract info from a 3D seismic cube • RMS amplitude in 40 ms window about horizon • Dip analysis • Sun illumination • Waveform map by fuzzy clustering 4. 3D seismic survey
Hohbein & Cartwright, 2006; van Weering et al. 2008 Case study • 3D analysis of buried sediment waves • West Shetland drift • Contour current formation 4. 3D seismic survey
Summary • Sub-bottom techniques aim to image the stratigraphy and properties of geological layers beneath the sea bed • Rarely are bathymetry data interpreted without reference to some sort of sub-bottom information. Therefore it is important to have covered the principles and techniques of ‘seeing through the sea-floor’ in the module. • Variety of techniques available that trade off between resolution, depth of penetration, and expense (time and financial). • Many applications of sub-bottom data which improve understanding and exploration of sea-floor environments • Sediment drifts around Antarctica have been extensively studied using sub-bottom profiler and seismic data, and much of the knowledge about their processes and formation comes from these observations. GEO3238: EXPLORING THE SEA FLOOR
Summative Coursework • Task: • A UK-based client, Graham Industries Inc., have commissioned you to file a report on the following: • An analysis of the bathymetry of the continental rise, offshore of the Antarctic Peninsula • They are a new and rookie venture who are interested in dredging for coarse sand and gravel aggregates on rise deposits, and disposing of the spoils. As a freelance bathymetric specialist, they have asked that you provide them with a technical report that includes: • A comprehensive terrain analysis of the continental rise study area - providing the base layer information to benthic habitat mapping that they will go on to undertake. • A detailed evaluation of the seafloor geomorphology and processes that have and continue to shape the environment of the continental rise. • An assessment of possible site impacts and overall feasibility with respect to other stakeholders and scientific interests in the region. • Accompanying the report, they have requested a 1-minute long 3D visualisation (movie format) of the study area to present to their board members.
Technical reports: considerations • Good technical writing results in relevant, useful and accurate information geared to specifically targeted audiences in order to enable a set of actions on the part of the audience in pursuit of a defined goal. • If you haven’t come across a technical report before look here: • https://en.wikipedia.org/wiki/Technical_report • Consider the audience to be scientifically literate and hungry for detail. Don’t dumb things down, but showing your own understanding/explaining concepts clearly is important. • Content: • See the handout which I will circulate tomorrow (8th Feb). • Structure: largely up to you • I will provide some guidance on what to include in the handout • Reading: • Some indicative reading will be posted to ELE coursework resources folder this week. GEO3238: EXPLORING THE SEA FLOOR