Download
1 / 63
630 likes | 642 Vues
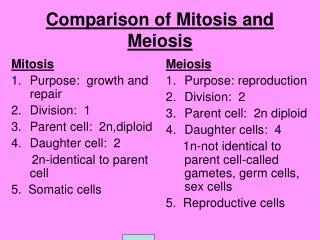
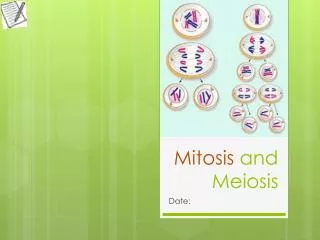
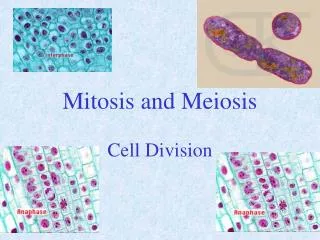
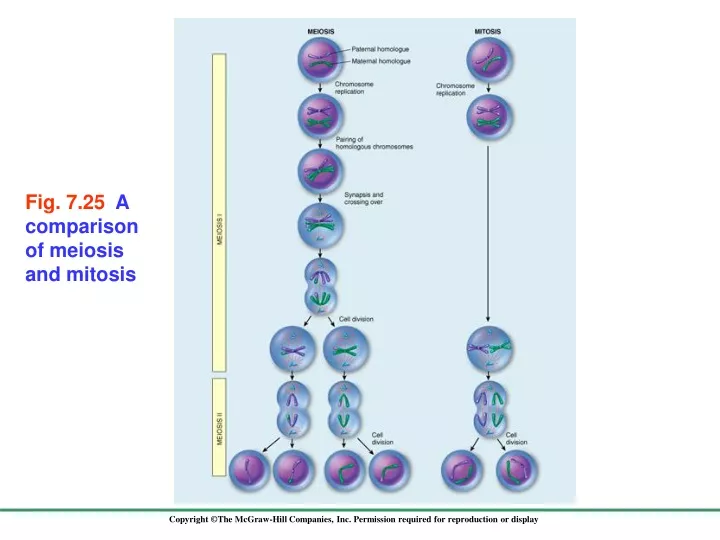
Fig. 7.25 A comparison of meiosis and mitosis. Fig. 7.26. Independent assortment. In humans, a gamete receives one homologue of each of the 23 chromosomes Humans have 23 pairs of chromosomes 2 23 combinations in an egg or sperm 8,388,608 possible kinds of gametes. Three chromosome pairs.

E N D
Fig. 7.26 Independent assortment • In humans, a gamete receives one homologue of each of the 23 chromosomes • Humans have 23 pairs of chromosomes • 223 combinations in an egg or sperm • 8,388,608 possible kinds of gametes Three chromosome pairs 23 combinations
Random fertilization • The zygote is formed by the union of two independently-produced gametes • Therefore, the possible combinations in an offspring • 8,388,608 X 8,388,608 = • 70,368,744,177,664 • More than 70 trillion! • And this number does not count crossing-over
Fig. 7.20 Crossing over • DNA exchanges between maternal and paternal chromatid pairs • This adds even more recombination to independent assortment that occurs later
Gregor Mendel (1822-1884) 8.1 Mendel and the Garden Pea • The tendency for traits to be passed from parent to offspring is called heredity • The first person to systematically study heredity • Austrian monk who studied science and mathematics • Worked with garden peas in his monastery
Fig. 8.2 Mendel’s Experimental System • Mendel chose the garden pea for several reasons • 1. Many distinctive varieties were available • 2. Small and easy to grow • 3. Short generation time and lots of offspring • 4. Both male and female reproductive organs are enclosed within the pea flower
Mendel’s Experimental Design • Mendel selected seven characteristics to study, each of which had two distinguishable traits • He let each variety self-fertilize for many generations to ensure it was true-breeding • He crossed individuals from two different varieties that differ in only one trait • P (parental) generation = Pure bred lines • F1 (First filial) generation = Offspring of cross-fertilization of parentals • F2 (Second filial) generation = Offspring of self-fertilization of F1 plants
Fig. 8.3 How Mendel conducted his experiments Mendel’s Experimental Design
8.2 What Mendel Observed • For all seven pairs of contrasting traits studied, Mendel observed the same results • 1. The F1 generation showed only one of the two parental traits • He called it the dominant trait • The recessive trait was not expressed • 2. The F2 generation showed an ~ 3:1 ratio of the dominant:recessive parental traits
Fig. 8.5 • Mendel let the F2 plants self-fertilize for another generation • He concluded from the results that the 3:1 ratio is a disguised 1:2:1 ratio
8.3 Mendel Proposes a Theory • Mendel proposed a simple set of hypotheses • 1. Parents do not transmit traits directly to their offspring • They do so via factors (now termed genes) • 2. Each parent contains two copies of the factor governing each trait • If the two copies are the same, the individual is called homozygous • If the two copies are different, the individual is called heterozygous
8.3 Mendel Proposes a Theory • Mendel proposed a simple set of hypotheses • 3. Alternative forms of a factor lead to different traits • Alternative forms are calledalleles • The appearance of an individual is its phenotype • The genetic composition of an individual is its genotype • 4. The two alleles that an individual possesses do not affect each other • 5. The presence of an allele does not ensure that its trait will be expressed in the individual
Fig. 8.6 Genes on homologous chromosomes Analyzing Mendel’s Results • Each trait is determined by the inheritance of two alleles: one maternal and one paternal • These alleles, present on chromosomes, are distributed to gametes during meiosis
Analyzing Mendel’s Results • Consider Mendel’s cross of purple-flowered with white-flowered pea plants • P (dominant) allele Purple flowers • p (recessive) allele White flowers • Using these conventions, the above cross can be symbolized as • PP X pp
Gametes P p P Gametes p Punnett Squares • A Punnett square is a grid structure that enables the calculation of the results of simple genetic crosses • Possible gametes are listed along two opposite sides • Genotypes of potential offspring are represented by the cells in the square PP Pp • The frequency of these genotypes in the offspring is expressed by a probability Pp pp
Fig. 8.8 How Mendel analyzed flower color Probability is 25% Probability is 100% 50% 25%
The Testcross • A genetic procedure devised by Mendel to determine an individual’s actual genetic composition • A purple-flowered plant can be homozygous (PP) or heterozygous (Pp) • One cannot tell by simply looking at the phenotype • One can tell from the results of a cross between the test plant and a homozygous recessive plant
Fig. 8.9 How Mendel used the testcross to detect heterozygotes
8.4 Mendel’s Laws • Mendel’s theory of heredity is one of the most important theories in the history of science • It has been so well supported by experimental results that his major proposals are considered “laws” • Mendel’s first law, or law of segregation • The two alleles of a gene separate when forming gametes, and gametes combine randomly in forming offspring • Mendel’s second law, or law of independent assortment • Alleles of genes located on different chromosomes are inherited independently of one another
P generation Round, yellow Wrinkled, green Fig. 8.10 Analysis of a dihybrid cross
Mendelian segregation of alleles can be disguised by a variety of factors Continuous variation Pleiotropic effects Incomplete dominance Environmental effects Epistasis Codominance 8.6 Why Some Traits Don’t Show Mendelian Inheritance
Fig. 8.12 Continuous Variation • Most traits are polygenic • They result from the action of more than one gene • These genes contribute in a cumulative way to the phenotype • The result is a gradation in phenotypes or continuous variation Extremes are much rarer than the intermediate values
Fig. 8.13 Pleiotropic Effects • Alleles that have more than one phenotypic effect are said to be pleiotropic • The effect may be dominant with respect to one phenotype, and recessive with respect to another • Pleiotropic effects are characteristic of many inherited disorders • Cystic fibrosis
Incomplete Dominance • Not all alternative alleles are fully dominant or fully recessive in heterozygotes • Some pairs of alleles exhibit incomplete dominance • They produce a heterozygote phenotype that is intermediate between that of the homozygotes • Example • Flower color in the Japanese four o’clock
Fig. 8.15 Environmental Effects Color resembles snowy background in winter • The expression of some genes is influenced by environmental factors, such as temperature Color resembles tundra background in summer • Some alleles are heat-sensitive • Arctic foxes make fur pigment only when the weather is warm
Epistasis • Interaction between two genes where one of them modifies the phenotypic expression of the other • In 1918, the geneticist R. A. Emerson crossed two true-breeding corn varieties with white kernels • To his surprise, all F1 plants had purple kernels • The plants of the F2 generation showed a ratio of 9 purple : 7 white • Mendelian genetics predicts a 9:3:3:1 ratio • So why is Emerson’s ratio modified?
Fig. 8.16 • There are two genes that contribute to kernel color • B Production of pigment • A Deposition of pigment • Either gene can block the other’s expression • To produce pigment a plant must possess at least one functional copy of each gene
Fig. 8.18 Codominance Unlike incomplete dominance, both alleles are expressed • Some pairs of alleles exhibit codominance • They produce a heterozygote phenotype that is a combination of that of the two homozygotes • Example • Roan color in horses
The gene (termed I) that determines the ABO blood group in humans has more than one dominant allele • The encoded enzyme adds sugar molecules to lipids on the surface of red blood cells • A adds galactosamine • B adds galactose • o adds neither sugar • The AandBalleles are codominant • The o allele is recessive to both • The different combinations of the three alleles produces four different phenotypes
Possible alleles from female IA or IB or i IAIA IAIB IAi IA or IB IAIB IBIB IBi Possible alleles from male or i IAi IBi ii Blood types A AB B O Fig. 8.19 Multiple alleles controlling the ABO blood groups
The chromosomal theory of inheritance was first formulated by Walter Sutton in 1902 8.7 Chromosomes Are the Vehicles of Mendelian Inheritance • It basically states that Mendelian factors are found on chromosomes • Investigators soon pointed out a major problem with the theory • Number of independently assorting traits is far more than an organism’s number of chromosome pairs
Confirmation of Sutton’s theory was provided by a single fruit fly, discovered by Thomas Hunt Morgan in 1910 Fig. 8.20 8.7 Chromosomes Are the Vehicles of Mendelian Inheritance • The mutant was awhite-eyedmale • Drosophila wild-type flies are red-eyed • Morgan immediately set out to determine whether this new trait is inherited in a Mendelian fashion
P: white-eyed male X red-eyed female • All F1 was red-eyed • Thus, red eye color is dominant over white • The F1 was then self-crossed • The F2 was • ~ 1/2 red-eyed female • ~ 1/4 red-eyed male • ~ 1/4 white-eyed male • Thus, the eye color segregates • But why is white-eyes only found in males?
In Drosophila, the sex of an individual is determined by the number of X chromosomes • Female flies have two X chromosomes • Male flies have only one • The solution to Morgan’s puzzle is that the gene for white eye color resides only on the X chromosome • A trait determined by genes on the sex chromosomes is said to be sex-linked • Let’s revisit Morgan’s experiment while showing the Mendelian assortment of chromosomes
Fig. 8.22 The chromosomal location of Mendel’s seven characters Independent segregation is not possible with this pair of traits
8.8 Human Chromosomes • Human somatic cells have 23 pairs of chromosomes • 22 pairs of autosomes • 1 pair of sex chromosomes • XX in females • XY in males • Failure of chromosomes to separate correctly in meiosis I or II is termed non-disjunction • This leads to an abnormal number of chromosomes, or aneuploidy
Fig. 8.23 Nondisjunction in anaphase I Nondisjunction can also occur in anaphase II
8.8 Human Chromosomes • Humans with one less autosome are called monosomics • These do not survive development • Humans with one extra autosome are called trisomics • The vast majority do not survive • Trisomy for only a few chromosomes is compatible with survival • However, there are severe developmental defects
Fig. 8.24 Down Syndrome • Caused by trisomy 21
Fig. 8.25 Down Syndrome • Frequency is about 1 in 750 children 1 in 1,500 if mother is under 30 • However, it is much more common among children of older women 1 in 16 if mother is over 45
Nondisjunction Involving Sex Chromosomes • Aneuploidies of sex chromosomes have less serious consequences than those of autosomes • However, they can lead to sterility • Nondisjunction of the Y chromosome • Yields YY gametes and ultimately XYY zygotes • Frequency of XYY is 1 in 1,000 males • In general, these are phenotypically normal
Mutations are accidental changes in genes They are rare, random and tend to produce recessive alleles Mutations cause genetic disorders The inheritance of these disorders, as well as harmless traits, is studied by looking at pedigrees Family trees that identify individuals with the disease/trait 8.9 The Role of Mutationsin Human Heredity
Hemophilia: A Sex-Linked Trait • Hemophilia is an inherited condition in which the blood clots slowly or not at all • Two genes that encode blood-clotting proteins reside on the X chromosome • Hemophilia is an X-linked recessive disorder • Males develop hemophilia if they inherit one mutant allele from their mother • For females to develop hemophilia, they have to inherit two mutant alleles, one from each parent