Download
1 / 48
490 likes | 497 Vues
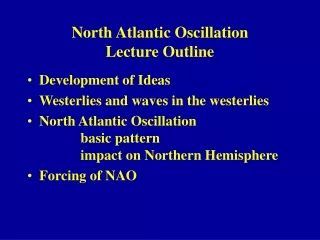
North Atlantic Oscillation Lecture Outline. Development of ideas Westerlies and waves in the westerlies North Atlantic Oscillation basic pattern impact on Northern Hemisphere Forcing of NAO Economical impacts. Development of Ideas.

E N D
North Atlantic OscillationLecture Outline • Development of ideas • Westerlies and waves in the westerlies • North Atlantic Oscillation basic pattern impact on Northern Hemisphere • Forcing of NAO • Economical impacts
Development of Ideas • Hans Egede Saabye made the following observation in a diary which he kept in Greenland during the years 1770-78:
1920s Walker NAO • 1950s Jerome Namias: Index Cycle • 1950s Ed Lorenz: Lorenz Boxes • 1980s Lamb and Peppler • 1995 onwards: Work begins!
Westerlies and waves in the westerlies Poles Subtropics Pressure Gradient Force
Con Div Vertical motion in Rossby Wave LOW Vorticity maximum LOW
North Atlantic OscillationBasic patterns and impact on Northern Hemisphere
North Atlantic Setting • High Pressure over the Azores • Low Pressure over Iceland • Westerly wind • low pressure systems (rain) travel in the westerlies
North Atlantic Oscillation • Azores high and Icelandic Low are the centres of action • Azores high can weaken or strengthen • Icelandic low can weaken or strengthen • Tendency for Azores high and Icelandic low to be negatively correlated
What is the North Atlantic Oscillation ? A sea saw of atmospheric mass which alternates between the polar and subtropical regions. Changes in the mass and pressure fields lead to variability in the strength and pathway of storm systems crossing the Atlantic from the US East coast to Europe. The NAO is most noticeable during the winter season (November - April) with maximum amplitude and persistence in the Atlantic sector.
NAO index An Index can be constructed that represents the phase of the NAO. Most commonly the NAO index is based on the surface pressure (SLP) difference between the Subtropical (Azores) high and the Subpolar (Island) low. Very often the pressure readings from two stations one on Iceland and the other either the Azores, Lisbon or Gibraltar are used to construct the NAO index. The twice daily reading are averaged from November through March and the difference in then the winter NAO index.
The NAO index: interannual signal + decadal variability (quite strong at the beginning and end of the 20th century) the recent 30 years trend possibly linked to "global warming".
The negative NAO index phase • Azores high weak • Icelandic Low shallow • westerlies weak • NW Europe cold and dry • wet conditions in Med and N Africa • US east coast cold outbreaks and snow • Greenland mild conditions
The positive NAO index phase • Azores High strong • Icelandic Low deep • westerlies strong • wind and rain • mild conditions in NW Europe • dry conditions in Med and N Africa • Dry and cold in N Canada and Greenland • Eastern USA wet and mild
NCAR CCM3 simulations. Difference in sea level pressure between winters (December-March) with an NAO index value > 1.0 and those with an index value < –1.0 (high minus low index winters) since 1899. The contour increment is 2 hPa and negative values are dashed. The index (right) is based on the difference of normalized sea level pressure between Lisbon, Portugal and Stykkisholmur/Reykjavik, Iceland from 1864 through 2000. The heavy solid line represents the index smoothed to remove fluctuations with periods less than 4 years.
Impacts of the North Atlantic Oscillation
NAO „-“ NAO „+“
NAO „-“ NAO „+“
NAO „-“ NAO „+“
Forcing of NAO • Internal variability in the atmosphere • Ocean forcing • Ocean-Atmosphere coupling • Atmosphere – Ocean • Stratospheric forcing Observational studies Modelling Studies
Internal Variability • Models forced with non-varying SST still produce a NAO response (Barnett, 1985; Marshall and Molteni, 1993, e.g., Kitoh et al. 1996; Saravanan 1998; Osborn et al. 1999; Shindell et al. 1999). • Fundamental mechanism of NAO may be internal atmospheric variability – • Phase and amplitude of NAO can be forced • Ocean models forced with noise can generate coherent decadal SST patterns
SST Forcing • Modelling • Davies et al 1997 forced HADAM1 with observed SST 1949-1993. • NAO pattern similar to observed • Rodwell et al 1999 Nature • Observational • Sutton and Allen 1997 Nature • Hurrell
Coupled Mechanisms • NAO may be determined by an inherently coupled interaction between ocean and atmosphere • Low frequency response of the ocean to atmospheric forcing and its feedback on the atmosphere result in decadal oscillations • 2 possible mechanisms exist:
Mechanical and thermal interaction between the wind-driven ocean gyres and overlying atmospheric circulation - gyre dynamics then set decadal time scales (e.g. Deser and Blackmon, 1993) • variability is governed by processes that modulate the strength of the meridional or thermohaline circulation (and heat transport) - hence SSTs (e.g. Latif, 1996)
CMIP, the Coupled Model Intercomparison Project, is the analog of AMIP for global coupled ocean-atmosphere general circulation models. • CMIP began in 1995 under the auspices of the Working Group on Coupled Models (WGCM) of CLIVAR.
NAOMIP is a multi-national CMIP sub-project to compare the coupled ocean-atmosphere model simulations of the annual, interannual, and interdecadal variability in the North Atlantic Oscillation.
OCEAN - ATMOSPHERE INTERACTION Sensible and latent heat flux wind stress Sensible and latent heat flux
OCEAN - ATMOSPHERE INTERACTION: AOGCM Experiments Sensible and latent heat flux wind stress Sensible and latent heat flux Model calculates SSTs Wind stress heat fluxes O-A and A-O
OCEAN - ATMOSPHERE INTERACTION: AOGCM Experiments Sensible and latent heat flux wind stress Sensible and latent heat flux Hypotheses dependent on model behaviour
ATMOSPHERE - OCEAN INTERACTION: OGCM Experiments wind stress
Animation of sea level pressure and surface winds during an idealized NAO cycle of 12 year duration. • The lower panel shows the land temperature response and the propagation of SST anomalies in the ocean. • The ocean is simulated by the Lamont Ocean model (LOAM) • All other data are regressions from the NCEP/NCAR reanalysis. SLP and Windstress As observed Observed land temps Modelled SSTs
Stratospheric forcing • NAO might be more appropriately thought of as an annular (zonally symmetric) hemispheric mode of variability characterized by a seesaw of atmospheric mass between the polar cap and the middle latitudes in both the Atlantic and Pacific Ocean basins (Thompson and Wallace, 1998; 1999), called the Arctic Oscillation. During winter, its vertical structure extends deep into the stratosphere. • Similar structure is evident in the Southern Hemisphere.
.....stratospheric forcing • During winters when the stratospheric vortex is strong, the AO (and NAO) tends to be in a positive phase. • Baldwin and Dunkerton (1999) suggest that the signal propagates from the stratosphere downward to the surface. • Recent trends in the tropospheric circulation over the North Atlantic could be related to processes which affect the strength of the stratospheric polar vortex, e.g. tropical volcanic eruptions (Robock and Mao 1992; Kodera 1994; Kelly et al. 1996), ozone depletion (Volodin and Galin 1999), and changes in greenhouse gas concentrations
Changes in the stratospheric circulation can influence the phase of the NAO. Ozone depletion and increase of CO2 both result in a strong polar night vortex which might cause the NAO to prefer a positive state.
Heating Oil consumption in Norway varies by 30% in good (anti) correlation with the NAO. Correlation with precipitation results in variability in hydropower generation.
NAO and Water Resources in Turkey and the Middle East Precipitation in Turkey is well correlated with the NAO. As a result spring stream flow in the Euphrates River varies by about 50% with the NAO. An upward trend in the NAO will lead to drought conditions in the Middle East.
Can current generation climate model's capture the observed features of the North Atlantic Oscillation ? • If so, which features depend on coupled ocean-atmosphere processes and which are purely atmospheric ? • How much role do land-atmosphere interactions play in the NAO ? • Useful website: http://www.ldeo.columbia.edu/NAO/links.html