Download
1 / 19
190 likes | 197 Vues
Towards a collaborative food action plan A report on food poverty in Cambridge. Sept 2018. Cambridge Food Poverty Alliance

E N D
Towards a collaborative food action plan A report on food poverty in Cambridge Sept 2018
Cambridge Food Poverty Alliance Cambridge Food Poverty Alliance (CFPA), formed in October 2017, aims to strategically alleviate food poverty in the city in collaboration with NGOs, the local council, businesses and importantly people who are experiencing food poverty. Aims of Alliance The Alliance has been formed with an aim to: • consult with users of relevant services and organisations providing services • share resources, best practice and information locally • research what has been done successfully elsewhere • develop a Collaborative Food Action Plan to ensure an evidence-based joined-up approach to food poverty in the City Sept 2018
The Cambridge Context • Cambridge was one of the fastest growing economies in Q1 2018 • The skilled tech and life sciences sectors has significantly contributed to its economic activity. • Cambridge is identified as the most unequal city in the UK, for the second year running, highlighting the uneven distribution of income Sept 2018
A snapshot Income: difference between net annual income difference between Market/ Newnham and Kings Hedges is £16000 per year Housing: Average House price Q2 2018 is £548, 477 and average rent £948 with average growth 2.1% per annum Fuel Poverty: General decrease with fluctuations. Estimates are that 11.5% households are in fuel poverty Sept 2018
IMD data for Cambridge • Most deprived areas Abbey, Arbury, East Chesterton, Kings Hedges • Abbey being in the most deprived 20% areas nationally, areas in Kings Hedges, East Chesterton and Arbury in the most 30% deprived • most deprived domain is Living Environment, which includes factors such as air quality and housing quality Sept 2018
City Council’s mapping poverty report 2017 • 1 in 10 claiming housing benefit and council tax support • Distribution corresponds to areas of higher deprivation • Trumpington saw an increase in people claiming, Abbey remained the ward with highest number of claimants • 30,000 changes annually people moving in and out of benefits Sept 2018
Impact on Health • Life expectancy difference in living in the most deprived and least deprived areas • People living most deprived areas begin to experience significant illness and disability at earlier stages in life Sept 2018
Children • Uk average 28% children in poverty • Abbey has highest 32%, Trumpington 31% and Market (1.5% in 2013 to 17% in 2017) • One in 5 children in City at risk (22%) Sept 2018
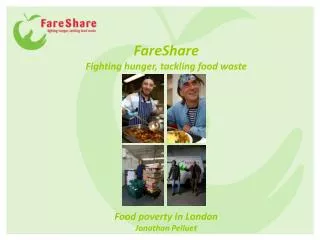
Food Bank Use • Cambridge City Food Bank , 8 distribution centres ( 2 outside city) 3 day emergency food parcels • Last five years rising 51% for adults and 80% for children ( 2013- 17) • Kings Hedges highest number of voucher users increasing 70% 2013- 17 • National data suggests with roll out of universal credit food bank usage has increased 52% • Studies show number of people in food poverty can be between 10 and 17x higher than numbers using food banks. In Cambridge this could be 13,000 to 54,000 Sept 2018
Reasons for Food Bank use in Cambridge 2013 and 2017 Sept 2018
Healthy Start Vouchers • Scheme run for pregnant women and women who have children under 4 to buy milk, fruit and veg and vitamins. Income related benefits apply • Beneficiaries eligible July/ Aug 18 were 631 uptake was 371 ( 59%) • Highest number eligible Arbury, Kings Hedges, Chesterton and Castle ( postcode data only available) Sept 2018
Free School Meals • Eligibility is changing with Universal Credit roll out, Threshold for household income £7400 after tax. Fewer families eligible • Estimated 4657 children are eligible for free school meals in city with an uptake of 36% Sept 2018
Food Poverty Alliance questionnaire • Survey targeted at those in poverty, Wintercomfort, Holiday Lunches, Food Cycle, Cambridge Housing Society and C3 Church • Undertaken to understand how people experience food poverty and what strategies they may employ to cope with the situation • 71 respondents • Food Insecurity Experience Scale ( FIES) Sept 2018
Singles and families experienced food poverty differently. Single individuals more likely to have problems accessing healthy foods, eat less portion wise and experience hunger • families (over 50%) interviewed were eating only a few kinds of food - lack of varied diet, reliance on cheaper processed food. • 50% ( in the main women) families were skipping meals or going a whole day without food in order to feed children or partners Sept 2018
Initiatives for reducing food poverty in Cambridge • Holiday lunches • Wintercomfort • Fairbite • Cambridge Food Bank • Food Cycle • Community Fridge • Cookery Workshops Sept 2018
Complex issue, certain demographics at higher risk, those with dependants, the homeless or at risk of homelessness, those suffering long term health issues • Experienced on a spectrum with a range of physical and psychological impacts and that within households there were those that experienced food poverty more severely than others. Usually women. • As universal credit is rolled and housing costs situation will only get worse • Residents who work as well as those on benefits are finding it challenging to cover costs, often having to choose between rent, fuel and food • BREXIT!! ( not covered in the report - food shortages? Increased prices?) Sept 2018
Recommendations • Adopt a rights based approach to food poverty - collaborative action plan, experts by experience • Data collection and monitoring • Understand the geographical needs of the city - food desserts, future service provision to understand changing needs of the city eg: Trumpington area • Improve signposting between organisations • Maximise family income • Promote access to healthy, affordable, high quality and nutritious food • Promote a better connection to our food system Sept 2018
Report available www.cambridgesustainablefood.org email : CFPA@cambridgesustainablefood.org Sept 2018