Download

1 / 13
130 likes | 134 Vues
This study analyzes the incidence, impact, and trends of acute rejection in Australia and New Zealand from 1997 to 2002. The study highlights the importance of size, gender, ethnicity, and immunology in acute rejection. Real-world data from ANZDATA provides valuable insights for transplant outcomes.

E N D
Acute Rejection in ANZ 1997-2002 Steve Chadban, Bianca Leonardi, Graeme Russ, Scott Campbell & Stephen McDonald On behalf of ANZDATA TSANZ 2003 ANZDATA 2003
What’s the problem with acute rejection? Not a problem: 1. Progressively less common 2. >90% treatable 3. If entirely reversible, no impact on graft survival 4. Of lesser importance in long-term outcomes Really, it is still a problem: 1. 10-40% of recipients 2. Occasional cause of graft loss 3. Risk factor for ‘chronic allograft nephropathy’ 4. Costs money 5. Correlates with cancer Walker et al, Transplantation 1998
Acute Rejection, ANZ, 1997-2002 Australia New Zealand Total grafts 2550 551 3123 AR 863 (34%) 200 (36%) 1064 (34%) Recurrent 265 (10%) 66 (12%) 331 (11%) BPAR 90% 70% 86% (90% 2000-) Of BPAR: Vascular 38% 32% 37% ANZDATA 2003
Rejection-free survival, ANZ, 1997-2002 3123 grafts 1064 (34%) - at least 1 AR 331 (11%) >1 AR 340 (11%) vascular ANZDATA 2003
Year of transplant – probable reduction 2001-2 Year Australia NZ total ANZDATA 2003
Gender – males experience more AR ANZDATA 2003
Peak PRA significant in cadaver graft recipients ANZDATA 2003
More AR seen in Living Unrelated Donor transplants ANZDATA 2003
Other factors affecting AR in ANZ 1997-2002 Ethnicity – less AR in: Asians (OR 0.51 LD, 0.69 cadaver) BMI - <20 less AR Drugs – Steroid avoidance associated with more AR 32% vs 48%, OR 2.0 p<0.001. - all others equal! Graft Number – trend to more AR for subsequent grafts Duration on dialysis – no effect Delayed graft function – pending. ANZDATA 2003
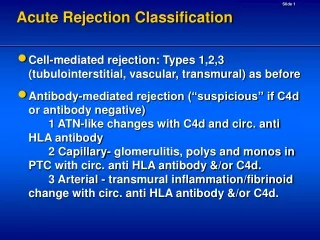
Acute Rejection in ANZ 1997-2002 • 34% incidence of AR – higher than current trials • 90% biopsy proven • Up to one-third will have >1 episode • Up to one-third have a vascular component • Incidence of AR declining over time • Hypothesis: size matters • female gender, Asian, BMI<20 associated with less AR • Immunology still matters • Sensitization (peak PRA) and HLA mis-match are • associated with AR • Multivariable model required, particularly re drug effect • ANZDATA will provide real-world information ANZDATA 2003