Download
1 / 16
160 likes | 166 Vues
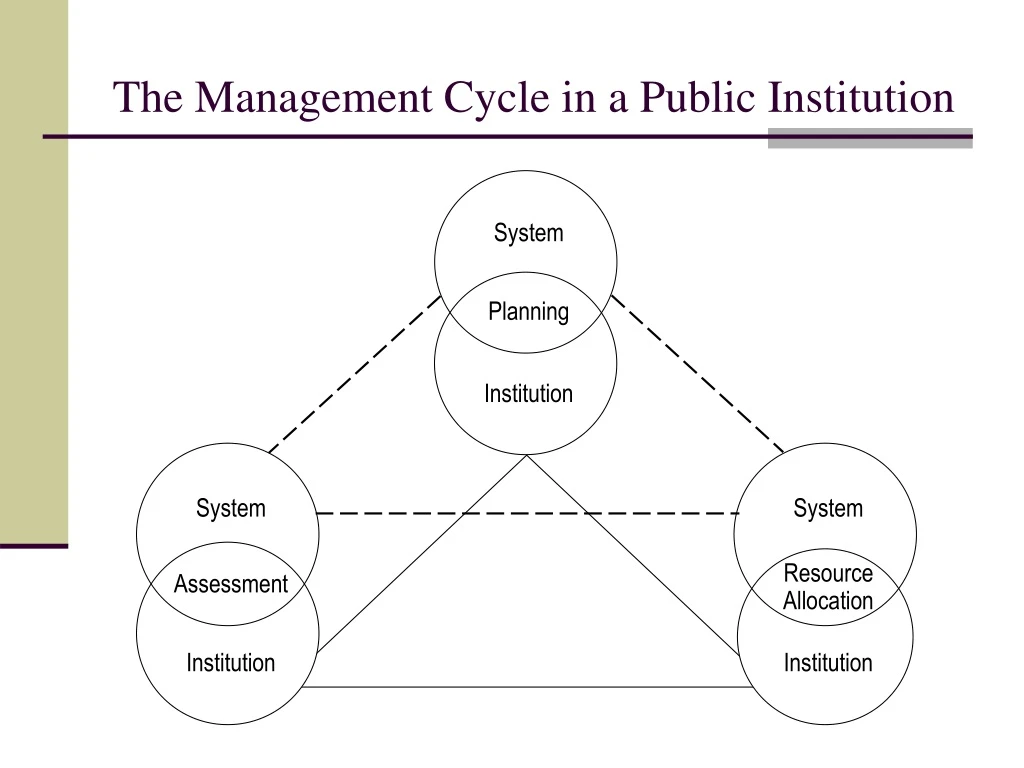
System. Planning. Institution. Syst e m. Syst e m. Resource Allocation. Assessment. Institution. Institution. The Management Cycle in a Public Institution. Client Expectations—The State. Expansion and Diversification of the Economy Improving Performance of K-12 Education

E N D
System Planning Institution System System Resource Allocation Assessment Institution Institution The Management Cycle in a Public Institution
Client Expectations—The State • Expansion and Diversification of the Economy • Improving Performance of K-12 Education • Contributing to Solution of Problems Normally Addressed in Other Agencies of State Government • Social Services • Corrections • Environmental Quality • Labor/Commerce • Etc.
100 Best Performing State U.S. Average Wisconsin 84 80 78 67 60 58 45 42 38.8 40 38 33 28 26.7 26 25.4 22 20 18 0 Graduate from Enter College Enroll Sophomore Graduate within 25 to 44 with a High School Year 150% Bachelor's Student Pipeline: Of 100 9th Graders – the number who graduate from high school within four years, go directly to college, return their second year, and graduate within 150% of program time (2000)
Interstate Migration of Adults with a Bachelor’s Degree or Higher: Change in Stock of Adults with a Bachelor’s Degree or Higher Minus Number of Bachelor’s Degrees Awarded (1990 to 2000) – 25- to 64-Year-Olds 200 193 (In Thousands) 167 106 82 74 67 64 58 44 33 21 20 15 0 2 -1 -4 -7 -8 -9 -10 -12 -13 -14 Texas Idaho -17 -17 Virginia Alaska Florida -19 Arizona Oregon Georgia Nevada -24 Maryland Colorado -27 -30 Washington New Jersey -37 New Mexico Wyoming North Carolina -46 Minnesota Tennessee Hawaii -49 -50 -51 -51 Montana -53 Maine -57 Delaware Arkansas Vermont -72 South Carolina Kentucky -75 South Dakota -79 -80 Nebraska Utah North Dakota Kansas -88 -93 New Hampshire Illinois Mississippi Connecticut -109 West Virginia -120 -124 Rhode Island California Iowa Wisconsin Oklahoma -138 Alabama Louisiana Missouri Indiana Michigan -173 -200 Massachusetts Ohio From 1990 to 2000, Wisconsin Produced 272,629 Bachelor’s Degrees – While the Number of Adults 25-64 with a Bachelor’s Degree or Higher Rose by 197,940 -281 Pennsylvania -400 -380 New York Source: U.S. Census Bureau, IPEDS Completions Survey, Tom Mortenson, Postsecondary Opportunity
Economy Tax Revenues • • • • K-12 Corrections Health Care Other Govt. State and Local Government Higher Education Income Student Aid Appropriations/Grants DonorsFoundationsCorporations Tuition Gifts Students Institutions Scholarships &Waivers Student Aid (Restricted) Research and Other Grants (Restricted) FederalGovernment The Flow of Funds
0.125 0.071 0.039 0.038 0.05 0.037 1990-91 1991-92 1997-98 1998-99 1999-2000 2000-2001 2001-01 2001-02 1992-93 1994-95 1995-96 1996-97 Change in Resident Undergraduate Student Charges and State Appropriations, Public Colleges and Universities, 1990-91 to 2001-02 Source: AASCU/NASULGC 2001
Family Ability to Pay (50%) Family Ability to Pay (50%) Low-Priced Colleges (20%) Low-Priced Colleges (20%) Need-Based Financial Aid (20%) Need-Based Financial Aid (20%) At Public 4-Yr Colleges* Low Student Debt (10%) Low Student Debt (10%) At Private 4-Yr Colleges* At Private 4-Yr Colleges* Category Index Score At Community Colleges* Category Index Score At Community Colleges* At Public 4-Yr Colleges* Category Grade Category Grade STATE STATE Alabama F 57 78 75 74 1 47 91 Alaska D 63 83 83 100 0 59 96 Arizona D- 62 71 69 59 2 97 82 Arkansas C 74 95 88 83 32 67 96 California A 100 68 62 42 44 293 83 Colorado C- 72 88 87 53 39 74 81 Connecticut C- 71 83 71 53 89 64 78 Delaware F 54 75 60 78 8 60 72 Florida D- 60 71 77 52 15 64 95 Georgia D 65 91 95 58 0 71 88 Hawaii D 65 84 72 70 2 92 84 Idaho D+ 69 94 89 81 1 72 92 Illinois B 85 88 76 63 123 70 87 Indiana D+ 69 74 72 61 72 51 93 Iowa C 73 85 90 70 56 51 100 Kansas C- 72 97 92 78 16 71 94 Kentucky C 74 95 92 80 34 62 98 Louisiana D 63 97 82 39 1 70 91 Maine F 56 70 69 51 37 40 91 Maryland D- 62 80 70 56 39 54 79 Massachusetts D- 62 78 71 41 83 52 77 Michigan D+ 68 83 68 85 45 60 97 Minnesota B 85 100100 68 100 49 97 Mississippi D 64 85 78 75 1 66 102 Missouri D+ 67 98 81 68 18 71 91 Montana F 51 65 67 67 6 37 93 Nebraska D 66 90 80 70 12 67 97 Nevada D+ 68 75 76 61 25 82 85 New Hampshire F 45 67 61 56 6 31 78 New Jersey C- 72 74 64 62 98 49 87 New Mexico C- 70 83 77 43 24 84 98 New York F 56 55 59 42 86 30 83 North Carolina C 75 89 88 55 29 100 87 North Dakota D 65 87 87 118 3 46 105 Ohio F 55 68 61 59 35 43 87 Oklahoma C 74 98102 71 15 67 95 Oregon F 53 66 60 44 21 54 85 Pennsylvania D+ 67 76 59 51 102 44 85 Rhode Island F 43 58 50 40 18 46 73 South Carolina D+ 67 91 68 71 33 67 89 South Dakota F 59 83 87 73 0 35 100 Tennessee D- 61 79 74 60 19 62 91 Texas D+ 67 81 72 59 17 89 91 Utah B 86 103108156 3 75 98 Vermont F 56 59 47 52 84 32 74 Virginia B- 81 102 85 75 42 100 84 Washington C- 70 80 77 57 63 58 85 West Virginia F 57 63 68 57 27 43 95 Wisconsin C 76 94 95 65 61 49 95 Wyoming D 66 85 87 0 0 66 98 ** State Comparisons: Index Scores—Affordability * Weights within the Family Ability to Pay indicators are based on enrollment by type of institution. The zero score for Wyoming on Family Ability to Pay at Private 4-Year Colleges is weighted at zero, and as a result does not affect the state’s overall grade for affordability. **Actual Index Score is over 100. Notes: Numbers in bold refer to best-performing states.
8-Year Spending Growth Rate 8-Year Spending Growth Rate Annual Avg. Advantage for Higher Ed. Annual Avg. Advantage for Higher Ed. Rank State Rank State All Programs H.E. All Programs H.E. 1 2 3 4 5 6 7 8 9 10 11 12 13 14 15 16 17 18 19 20 21 22 23 24 Nevada New Jersey Virginia Connecticut Massachusetts Illinois Arizona Pennsylvania Delaware Colorado Maryland Rhode Island Michigan California North Carolina Florida New York Alaska United States Ohio New Hampshire Missouri Tennessee Indiana Wisconsin 1.9 1.3 0.6 0.4 0.3 0.3 0.3 0.1 -0.1 -0.2 -0.2 -0.2 -0.3 -0.3 -0.3 -0.6 -0.6 -0.7 -0.7 -0.7 -0.7 -0.7 -0.9 -1.0 -1.1 67.5 39.5 47.4 40.0 39.9 39.2 59.9 37.5 42.6 50.3 42.6 38.9 37.5 52.2 55.3 57.5 44.1 41.8 47.4 40.2 46.8 43.6 51.9 45.8 38.9 93.6 54.1 54.3 44.6 43.6 42.5 63.1 38.3 41.9 48.5 40.8 37.0 34.2 48.5 51.3 51.0 37.4 34.7 40.0 32.7 39.1 35.6 41.5 35.3 27.9 25 26 27 28 29 30 31 32 33 34 35 36 37 38 39 40 41 42 43 44 45 46 47 48 49 50 Georgia Kentucky Texas Iowa Minnesota South Carolina Washington Kansas Oklahoma Arkansas Hawaii West Virginia Oregon Nebraska Montana Alabama Maine Utah Idaho Mississippi Vermont Louisiana North Dakota South Dakota New Mexico Wyoming -1.0 -1.1 -1.2 -1.5 -1.5 -1.4 -1.5 -1.7 -1.7 -1.7 -1.9 -2.0 -1.9 -2.1 -2.2 -2.0 -2.2 -2.1 -2.2 -2.2 -2.9 -2.7 -3.3 -3.2 -3.0 -4.5 59.2 47.9 56.1 41.7 42.1 59.4 51.0 39.3 40.5 46.9 43.9 43.7 52.5 40.8 36.8 49.6 42.5 51.2 54.9 52.9 37.8 46.7 33.7 38.1 53.4 44.1 47.3 35.5 42.7 26.6 27.0 43.8 34.5 22.6 23.5 28.5 23.9 22.7 31.4 19.5 15.1 27.8 20.1 28.7 31.0 28.9 10.2 18.8 3.3 7.2 21.9 1.6 Percentage Change in Spending to Maintain Current Services Source: Rockefeller Institute of Government 2002
Rank State Percent Rank State Percent Rank State Percent 1 2 3 4 5 6 7 8 9 10 11 12 13 14 15 16 17 Vermont 3.1 North Dakota 2.2 Maine 1.3 New Jersey 0.6 Delaware 0.2 Wisconsin 0.0 Kansas -0.3 Montana -0.4 Maryland -0.5 New Hampshire -0.6 Arizona -0.7 Massachusetts -0.8 Utah -0.8 Oklahoma -1.3 Oregon -1.3 Nebraska -1.4 Ohio -1.4 18 19 20 21 22 23 24 25 26 27 28 29 30 31 32 33 South Dakota -1.7 Michigan -1.7 Rhode Island -1.9 Minnesota -1.9 Colorado -2.3 Alaska -2.4 California -2.5 Connecticut -2.9 West Virginia -2.9 Pennsylvania -2.9 Virginia -3.0 Georgia -3.2 United States -3.4 Kentucky -3.4 Arkansas -3.5 Hawaii -3.6 New Mexico -3.6 34 35 36 37 38 39 40 41 42 43 44 45 46 47 48 49 50 Iowa -3.7 New York -3.8 Illinois -4.2 Missouri -4.7 Washington -4.9 Idaho -5.0 Indiana -5.2 North Carolina -5.6 Texas -5.7 Florida -5.7 South Carolina -6.3 Wyoming -7.8 Mississippi -8.6 Louisiana -8.8 Alabama -9.2 Nevada -9.2 Tennessee -9.7 State and Local Surplus or Shortfall as a Percent of Baseline Revenues in Year 2010 Source: Rockefeller Institute of Government 2002
Tax Capacity Tax Effort 140 120 U.S. 100 80 60 1980 1982 1984 1986 1988 1990 1992 1994 1996 1998 2000 2002 State Tax Capacity and Effort (Index Scores) - Wisconsin Source: State Higher Education Executive Officers, Kent Halstead
State Appropriations Per FTE Student Family Share of Funding for Higher Education 140 120 100 U.S. 80 60 1980 1982 1984 1986 1988 1990 1992 1994 1996 1998 2000 2002 State Appropriations for Higher Education vs. Family Share of Higher Education Funding (Index Scores) - Wisconsin Source: State Higher Education Executive Officers, Kent Halstead
160 140 120 U.S. 100 80 1980 1982 1984 1986 1988 1990 1992 1994 1996 1998 2000 2002 Higher Education Priority – Higher Education Appropriations as a Percent of Tax Revenue (Index Score) - Wisconsin Source: State Higher Education Executive Officers, Kent Halstead
38 40 30 26 22 20 11 10 10 7 6 4 3 1 0 Cuts Fees Layoffs Furloughs Reorganize Privatization Rainy Day Fund Early Retirement Reduce Local Aid Tuition/Fee Increases Source: NASBO State Strategies Used to Reduce Budget Gaps, Fiscal Year 2002
350 301 280 210 134 140 113 70 42 0 Utah Ohio Illinois Iowa Texas Idaho Maine Hawaii Nation Indiana Virginia Florida Alaska Arizona Oregon Kansas Georgia Missouri Nevada Vermont Michigan Alabama Louisiana California Montana Wyoming Maryland Delaware Arkansas Kentucky Colorado Wisconsin Minnesota Oklahoma Tennessee Nebraska Mississippi Washington New York Connecticut New Jersey Pennsylvania West Virginia South Dakota Rhode Island New Mexico North Dakota Massachusetts South Carolina North Carolina New Hampshire Total Research and Development Expenditures Per Capita ($) - 2001 Source: National Science Foundation, US Census Bureau
240 219 180 120 71 66 60 19 0 Utah Ohio Iowa Illinois Texas Idaho Maine Hawaii Nation Virginia Florida Alaska Indiana Arizona Oregon Georgia Kansas Missouri Nevada Michigan Vermont Alabama Montana California Louisiana Maryland Arkansas Delaware Kentucky Wisconsin Colorado Minnesota Oklahoma Mississippi Tennessee Nebraska Wyoming Washington New York Connecticut New Jersey Pennsylvania West Virginia Rhode Island New Mexico North Dakota South Dakota North Carolina South Carolina Massachusetts New Hampshire Federal Research and Development Expenditures Per Capita ($) – 2001 Source: National Science Foundation, US Census Bureau
80 60 45 40 31 17 20 0 Utah Ohio Illinois Iowa Texas Idaho Maine Nation Hawaii Virginia Alaska Indiana Florida Arizona Oregon Kansas Georgia Missouri Nevada Michigan Vermont Alabama Louisiana California Montana Wyoming Maryland Arkansas Delaware Kentucky Colorado Wisconsin Minnesota Oklahoma Tennessee Nebraska Mississippi New York Washington Connecticut Pennsylvania New Jersey West Virginia Rhode Island North Dakota New Mexico South Dakota South Carolina North Carolina Massachusetts New Hampshire State, Local, and Institutional (Internal) Research and Development Expenditures Per Capita ($) – 2001 Source: National Science Foundation, US Census Bureau