Download

1 / 74
750 likes | 765 Vues
Chapter 23 Economics, Environment, and Sustainability. Case Study: Making Microloans to the Poor (1). Micro-lending or microfinance 1983: Muhammad Yunus Grameen (Village) Bank in Bangladesh Provides microloans; mostly to women “Solidarity” groups How does it work?

E N D
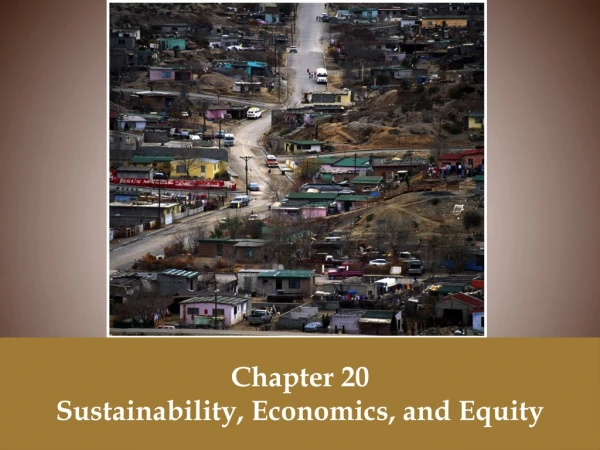
Chapter 23 Economics, Environment, and Sustainability
Case Study: Making Microloans to the Poor (1) • Micro-lending or microfinance • 1983: Muhammad Yunus • Grameen (Village) Bank in Bangladesh • Provides microloans; mostly to women • “Solidarity” groups • How does it work? • Half of borrowers eventually live above the poverty line
Case Study: Making Microloans to the Poor (2) • 2006: Muhammad Yunus • Nobel Peace Prize • 2006: Citibank and TIAA-Cref • Microloans
Muhammed Yunus with Nobel Prize Fig. 23-1, p. 613
23-1 How Are Economic Systems Related to the Biosphere? • Concept 23-1 Ecological economists and most sustainability experts regard human economic systems as subsystems of the biosphere
Economic Systems Are Supported by Three Types of Resources • Economic systems are supported by • Natural capital • Human capital, human resources • Manufactured capital, manufactured resources
Three Types of Resources Are Used to Produce Goods and Services Fig. 23-2, p. 615
+ + = Natural Capital Manufactured Capital Human Capital Goods and Services Fig. 23-2, p. 615
Market Economic Systems Depend on Interactions between Buyers and Sellers (1) • Supply, demand, market price equilibrium point • True free market system • No company or group controls prices of a good or service • Market prices include all direct and indirect costs (full-cost pricing) • Consumers have full information about beneficial and harmful environmental effects of goods and services
Market Economic Systems Depend on Interactions between Buyers and Sellers (2) • Real world • Tax breaks • Subsidies • Trade barriers • Withholding of negative information
Supply, Demand, and Market Equilibrium for a Good in a Market Economic System Fig. 23-3, p. 615
High Demand Supply Price Market equilibrium Low Low High Quantity Fig. 23-3, p. 615
Economic Growth and Economic Development • Economic growth • Increased capacity to supply goods and services • Requires increased production and consumption • Requires more consumers • Economic development • Improvement of living standards • Environmentally sustainable economic development
Gross World Product, 1970-2008 Figure 1, Supplement 9
Gross World Product per Person, 1970-2008 Figure 2, Supplement 9
Governments Intervene to Help Correct Market Failures • Private goods • Public services • Environmental protection • National security • Police and fire protection • Safe food and water • Provided by government because private companies can’t or won’t
Economists Disagree over Natural Capital, Sustainable Economic Growth (1) • High-throughput economies • Resources flow through and end up in planetarysinks where pollutant can be at harmful levels • Models of ecological economists • Economic systems as subsystems of biosphere • Conventional economic growth unsustainable • Wealth from depletion of natural capital
Economists Disagree over Natural Capital, Sustainable Economic Growth (2) • Ecological models’ three assumptions • Resources are limited and shouldn’t be wasted • Encourage environmentally beneficial and sustainable forms of economic development • Full-cost pricing needed to take into account harmful environmental and health effects of some goods and services • Environmental economists take middle ground between classical and ecological economists
High-Throughput Economies Rely on Ever-Increasing Energy, Matter Flow Fig. 23-4, p. 617
Inputs (from environment) System throughputs Outputs (into environment) Low-quality energy (heat) High-quality energy High-waste economy Waste and pollution High-quality matter Fig. 23-4, p. 617
Ecological Economists: Economies Are Human Subsystems of the Biosphere Fig. 23-5, p. 617
Solar Capital Goods and services Economic Systems Heat Production Natural Capital Depletion of nonrenewable resources Natural resources such as air, land, soil, biodiversity, minerals, and energy, and natural services such as air and water purification, nutrient cycling, and climate control Degradation of renewable resources (used faster than replenished) Consumption Pollution and waste (overloading nature’s waste disposal and recycling systems) Recycling and reuse Fig. 23-5, p. 617
What Is the Purpose of a Business? • Make a profit for its owners and investors • Sustainability is about staying in business • Another definition – “Making a quality product and earn a profit without harming the environment.”
23-2 How Can We Put Values on Natural Capital and Control Pollution and Resource Use? • Concept 23-2A Economists have developed several ways to estimate the present and future values of a resource or ecological service, and optimum levels of pollution control and resource use. • Concept 23-2B Comparing the likely costs and benefits of an environmental action is useful, but it involves many uncertainties.
Protecting Natural Capital • Estimating the values of the earth’s natural capital • Estimate nonuse values • Existence value • Aesthetic value • Bequest value, option value
Estimating the Future Value of a Resource Is Controversial • Discount rates • Estimate of a resource’s future economic value compared to its present value • Proponents of a high discount rate • Critics of a high discount
We Can Estimate Optimum Levels of Pollution Control and Resource Use • Marginal cost of resource production • Optimum level of resource use • Optimum level for pollution cleanup
Optimum Resource Use Fig. 23-6, p. 620
High Marginal cost of resource production Marginal benefit of resource use Cost Optimum level of resource use Low 50 0 25 75 100 Coal removed (%) Fig. 23-6, p. 620
Cost-Benefit Analysis Is a Useful but Crude Tool • Cost-benefit analysis follows guidelines • State all assumptions used • Include estimates of the ecological services • Estimate short-and long-term benefits and costs • Compare the costs and benefits of alternative courses of action • Always uncertainties
23-3 How Can We Use Economic Tools to Deal with Environmental Problems? • Concept 23-3 We can use resources more sustainably by including their harmful environmental and health costs in the market prices of goods and services (full-cost pricing); by subsidizing environmentally beneficial goods and services; and by taxing pollution and waste instead of wages and profits.
Most Things Cost a Lot More Than We Might Think • Market price, direct price • Indirect, external, or hidden costs • Direct and indirect costs of a car • Should indirect costs be part of the price of goods? • Economists differ in their opinions
Environmental Economic Indicators Could Help Us Reduce Our Environmental Impact • Measurement and comparison of the economic output of nations • Gross domestic product (GDP) • Per capita GDP • Newer methods of comparison • Genuine progress indicator (GPI) • Gross National Happiness (GNH)
Monitoring Environmental Progress: Comparing U.S. Per Capita GDP and GPI Fig. 23-7, p. 622
35,000 30,000 25,000 20,000 Per capita gross domestic product (GDP) 1996 Dollars per person 15,000 10,000 5,000 Per capita genuine progress indicator (GPI) 0 1950 1960 1970 1980 1990 2000 Year Fig. 23-7, p. 622
We Can Include Harmful Environmental Costs in the Prices of Goods, Services • Environmentally honest market system • Why isn’t full-cost pricing more widely used? • Many businesses would have to raise prices and would go out of business • Difficult to estimate environmental and health costs • Businesses have strong influence on government – preferential regulations, tax breaks, subsidies
Label Environmentally Beneficial Goods and Services • Product eco-labeling • Certification programs • Greenwashing
Reward Environmentally Sustainable Businesses • Phase out environmentally harmful subsidies and tax breaks • Phase in environmentally beneficial subsidies and tax breaks for pollution prevention • Political difficulties
Tax Pollution and Wastes Instead of Wages and Profits • Green taxes, ecotaxes • So that harmful products and services are at true cost • Steps for successful implementation of green taxes • Success stories in Europe
Trade-Offs: Environmental Taxes and Fees Fig. 23-8, p. 624
Trade-Offs Environmental Taxes and Fees Advantages Disadvantages Low-income groups are penalized unless safety nets are provided Help bring about full-cost pricing Encourage businesses to develop environmentally beneficial technologies and goods to save money Hard to determine optimal level for taxes and fees Governments may use money as general revenue instead of improving environmental quality and reducing taxes on income, payroll, and profits Easily administered by existing tax agencies Fig. 23-8, p. 624
Environmental Laws and Regulations Can Discourage or Encourage Innovation • Environmental regulation • Command and control approach • Incentive-based environmental regulations • Innovation-friendly regulations
We Can Use the Marketplace to Reduce Pollution and Resource Waste • Incentive-based regulation example • Tradable pollution or resource-use permits • Cap-and-trade approach used to reduce SO2 • Advantages • Disadvantages
Trade-Offs: Tradable Environmental Permits Fig. 23-9, p. 625
Trade-Offs Tradable Environmental Permits Advantages Disadvantages Big polluters and resource wasters can buy their way out Flexible Easy to administer May not reduce pollution at dirtiest plants Encourage pollution prevention and waste reduction Caps can be too high and not regularly reduced to promote progress Permit prices determined by market transactions Self-monitoring of emissions can allow cheating Fig. 23-9, p. 625
Reduce Pollution and Resource Waste by Selling Services Instead of Things • 1980s: Braungart and Stahl • New economic model • Service-flow economy, eco-lease (rent) services • Xerox • Carrier • Ray Anderson: lease carpets in the future
Individuals Matter: Ray Anderson • CEO of Interface, largest commercial manufacturer of carpet tiles • Goals • Zero waste • Greatly reduce energy use • Reduce fossil fuel use • Rely on solar energy • Copying nature • How’s it working?
Ray Anderson Fig. 23-A, p. 626
23-4 How Can Reducing Poverty Help Us to Deal with Environmental Problems? • Concept 23-4 Reducing poverty can help us to reduce population growth, resource use, and environmental degradation.
The Gap between the Rich and the Poor Is Getting Wider • Poverty • 1.4 billion people live on less than $1.25 per day • Trickle-down effect • Flooding up • Wealth gap