Download
1 / 27
270 likes | 284 Vues
Alexey V. Kiryukhin Institute of Volcanology and Seismology FEB RAS. OUTLINE:. Mutnovsky Geothermal Field Introduction. V-Mutnovsky Site: 12 MWe PP put in operation since 1999. Dachny Site: 50 MWe PP put in operation since 2002. Mutnovsky Geothermal Field Introduction.

E N D
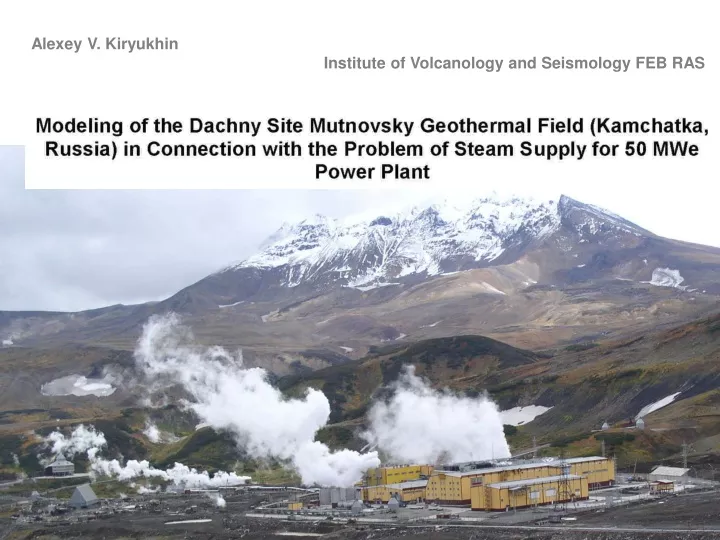
Alexey V. Kiryukhin Institute of Volcanology and Seismology FEB RAS
Mutnovsky Geothermal Field Introduction V-Mutnovsky Site: 12 MWe PP put in operation since 1999 Dachny Site: 50 MWe PP put in operation since 2002
Mutnovsky Geothermal Field Introduction History of exploitation: V-Mutnovsky Site: 12 MWe PP put in operation since 1999 Dachny Site: 50 MWe PP put in operation since 2002 Mutnovsky area include magmatic system of the active Mutnovsky volcano, numerios steam fields and hot springs
Mutnovsky Geothermal Field Introduction History of exploitation: V-Mutnovsky Site: 12 MWe PP put in operation since 1999 Dachny Site: 50 MWe PP put in operation since 2002 Mutnovsky area include magmatic system of the active Mutnovsky volcano, numerios steam fields and hot springs Mutnovsky is a fracture type geothermal field: Main and North-East single-fault typezones include Dachnyand V-Mutnovsky production reservoirs (Kiryukhin et al, 1998).
Conceptual Hydrogeological Model (Recharge\Discharge Conditions) Streamlines of fluids from Mutnovsky volcano recharge area to discharge areas through deeper part of zone, where heat and mass magmatic component exchange took place. Main Production Zone shown as apolygon area. Steam fields: 1 – Active crater of Mutnovsky volcano, 2 – Bottom Field, 3 – North Mutnovsky (W), 4 – Dachny; Hot springs: 5 – Piratovsky, 6 – Verkhne-Zhirovsky.
Conceptual Hydrogeological Model (Geometry of Production Zone) “Single fault” nature of the Main Production Zone demonstrated by small deviations of the points of the production () and full circulation loss () from plane equation formula Z = -1.691076246561*Х +0.48880109651512*Y +65583.1 Filled symbols correspond to production wells.
Conceptual Hydrogeological Model (Geometry of Production Zone) Wells isolated from “Single fault” in Dachny Site show low productivity
Dachny Site Conceptual Hydrogeological Model Conceptual hydrogeological model of the Dachny site Mutnovsky geothermal field was verified based on • circulation losses and production zones • distribution data, • mapping of active fracture zones, • gas and fluid chemistry data, • secondary minerals distributions, • recent results of drilling, • geothermal analog data Central part of the Dachny represent a “single fault” type geothermal reservoir. Upflow of the high temperature fluids occur in the south-east part of this zone
Numerical Model Setup In October 2002 Mutnovsky 50 MWe PP was put into operation in Dachny site. The problem of steam supply shortage (60%) to Mutnovsky 50 MWe PP (Dachny) trigged the new reservoir model study. Basic Software used: TOUGH2V2.0, A-Mesh, HOLA, additional subroutines implemented to model complex reservoir geometry, Graphics software.
Numerical Model Setup 3D Grid Generation 3D numerical grid correspond to the fault type geothermal reservoir of the Main Production Zone (120 m thick) connected with the 5-layers array of the Host Rocks.
Numerical Model Setup Sinks/Sources, Boundary Conditions Counters correspond to the top of the Main Production Zone. Open circles - sources assigned in the model (total upflow recharge estimated 54 kg/s, 1390 kJ/kg) Squares – inactive boundary elements (P,T=const) natural state steam discharge. Crossed squares- inactive boundary elements (P,T=const) liquid discharge.
Numerical Model Setup Model domains properties based on model calibration
Model Calibration Natural State Temperature Matches: 1 - key elements data 2 – modeling results
Model Calibration Natural State Pressure Matches: 1 - key elements data 2 – modeling results
Natural State Modeling Output Temperatures & Flows Distributions Temperatures & Pressure Distributions.
Model Calibration Based on 2002-2004 exploitation data • Well Head Pressures (WHP, bars, i) in exploitation wells • (SC “Geotherm”data)
Model Calibration Based on 2002-2004 exploitation data • Mutnovsky PP electricity output, total steam, total separate water production, and separator pressure (bars, i) (SC “Geotherm” data). • Note: individual wells parameters data not available.
Model Calibration • Exploitation wells assigned in the model based on TOUGH2V2.0 coupled wellbore flow option. • Productivity indexes PI0 of five production wells estimated accordingly to initial exploitation data (rate Q, wellhead pressures WHP) • and • flowing enthalpies h, reservoir pressure Pr, bottomhole Pb pressures tables, relative permeabilities (krs, krw) derived from the model (TOUGH2 or HOLA).
Three possible scenarios of additional • recharge into the Main Production Zone • under exploitation conditions • (including up-flow and reinjection) • were tested in the model: • (1) No additional recharge • (2) Marginal recharge • (3) Downflow recharge Model Calibration
Model Calibration Based on 2002-2004 exploitation data • Best model match (scenario #3, downflow recharge): modeling steam and separate production from wells 016, 26, Е4, 029W, Е5 (at 5.2 bar i separation pressure) against total production (dots).
Modeling of Exploitation Analysis of additional exploitation wells drilling in the high temperature upflow zone to maintain sustainable production for 50 MWe Power Plant.
Modeling of Exploitation • Scenario #1 (no additional recharge): sustainable steam production (96.3 kg/s or 48.2 MWe) during 10-year exploitation period.
Modeling of Exploitation • Scenario #2 (marginal recharge): sustainable steam production (116.7 kg/s or 58.4 MWe) during 10-year exploitation period.
Modeling of Exploitation • Scenario #3 (downflow recharge): sustainable steam production (86.7 kg/s or 43.4 MWe) during 10-year exploitation period.