Download
1 / 11
110 likes | 157 Vues
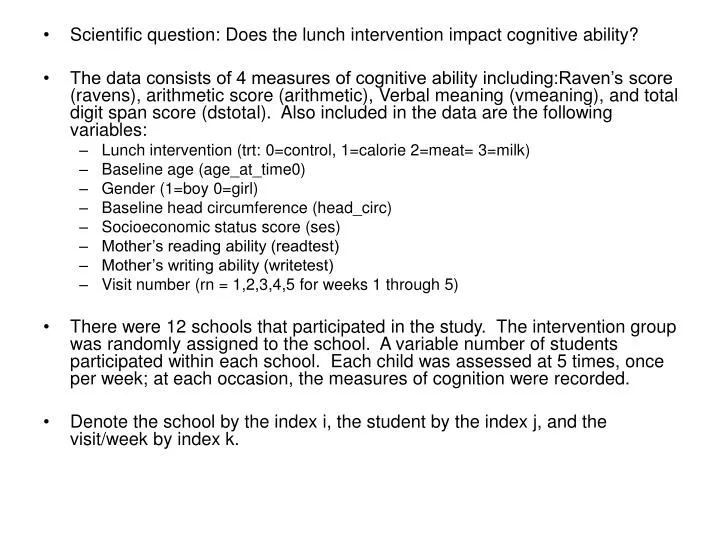
Scientific question: Does the lunch intervention impact cognitive ability?

E N D
Scientific question: Does the lunch intervention impact cognitive ability? • The data consists of 4 measures of cognitive ability including:Raven’s score (ravens), arithmetic score (arithmetic), Verbal meaning (vmeaning), and total digit span score (dstotal). Also included in the data are the following variables: • Lunch intervention (trt: 0=control, 1=calorie 2=meat= 3=milk) • Baseline age (age_at_time0) • Gender (1=boy 0=girl) • Baseline head circumference (head_circ) • Socioeconomic status score (ses) • Mother’s reading ability (readtest) • Mother’s writing ability (writetest) • Visit number (rn = 1,2,3,4,5 for weeks 1 through 5) • There were 12 schools that participated in the study. The intervention group was randomly assigned to the school. A variable number of students participated within each school. Each child was assessed at 5 times, once per week; at each occasion, the measures of cognition were recorded. • Denote the school by the index i, the student by the index j, and the visit/week by index k.
tab schoolid schoolid | Freq. Percent Cum. ------------+----------------------------------- 1 | 40 7.33 7.33 2 | 27 4.95 12.27 3 | 59 10.81 23.08 4 | 91 16.67 39.74 5 | 12 2.20 41.94 6 | 51 9.34 51.28 7 | 43 7.88 59.16 8 | 53 9.71 68.86 9 | 67 12.27 81.14 10 | 20 3.66 84.80 11 | 42 7.69 92.49 12 | 41 7.51 100.00 ------------+----------------------------------- Total | 546 100.00 The table below displays the number of children in each of the intervention groups. trt | Freq. Percent Cum. ------------+----------------------------------- control | 127 23.26 23.26 calorie | 146 26.74 50.00 meat | 131 23.99 73.99 milk | 142 26.01 100.00 ------------+----------------------------------- Total | 546 100.00
The distribution of students by school and intervention group is displayed in the table below. table schoolid trt ---------------------------------------------- | trt schoolid | control calorie meat milk ----------+----------------------------------- 1 | 40 2 | 27 3 | 59 4 | 91 5 | 12 6 | 51 7 | 43 8 | 53 9 | 67 10 | 20 11 | 42 12 | 41 ---------------------------------------------- The mean raven’s cognition scores by intervention group are displayed in the table below: table trt, c(mean ravens sd ravens) -------------------------------------- trt | mean(ravens) sd(ravens) ----------+--------------------------- control | 18.4389 2.557517 calorie | 18.1457 3.24382 meat | 18.5301 3.041299 milk | 17.9306 2.979153 --------------------------------------
Let Y_ijk be the raven’s score for child j at visit k from school i E(Y_ijk) = b0 + b1*calorie_i + b2*meat_i + b3*milk_i Ordinary Least Squares results: ------------------------------------------------------------------------------ ravens | Coef. Std. Err. t P>|t| [95% Conf. Interval] -------------+---------------------------------------------------------------- calorie | -.2932296 .1651898 -1.78 0.076 -.6171467 .0306875 meat | .0911374 .1704044 0.53 0.593 -.243005 .4252798 milk | -.5083678 .1664867 -3.05 0.002 -.8348281 -.1819076 _cons | 18.43894 .1209374 152.47 0.000 18.2018 18.67609 ------------------------------------------------------------------------------
Three level random intercept model Y_ijk = b0 + b1*calorie_i + b2*meat_i + b3*milk_i + u_i +u_ij + e_ijk • u_i ~ Normal(0, tau^2), tau^2 is the heterogeneity in ravens cognitive scores across schools • u_ij ~ Normal(0, eta^2), eta^2 is the heterogeneity in ravens scores across students from the same school • e_ijk ~ Normal(0,sigma^2), sigma^2 is heterogeneity in ravens scores from the same student taken at multiple times, or measurement error in scores over time. Var(Y_ijk) = tau^2 + eta^2 + sigma^2
------------------------------------------------------------------------------------------------------------------------------------------------------------ ravens | Coef. Std. Err. z P>|z| [95% Conf. Interval] -------------+---------------------------------------------------------------- calorie | -.2671385 .2804876 -0.95 0.341 -.8168841 .2826071 meat | .1233772 .2842285 0.43 0.664 -.4337005 .6804548 milk | -.5235633 .2759191 -1.90 0.058 -1.064355 .0172282 _cons | 18.43929 .200607 91.92 0.000 18.0461 18.83247 ------------------------------------------------------------------------------ Variance at level 1 This is the lowest level variance (corresponding to ijk) ------------------------------------------------------------------------------ 6.5508953 (.20426682) Variances and covariances of random effects ------------------------------------------------------------------------------ ***level 2 (id) This is the second level variance (corresponding to ij) var(1): 2.2728217 (.22912251) ***level 3 (school) This is the highest level variance (corresponding to i) var(1): .02935327 (.05318119) ----------------------------------------------------------------------------- Estimate of total variance is 6.55 + 2.27 + 0.03 The intra-class correlation coefficient for measurements from the same student (implying the same school) is 2.27 + 0.03 / (6.55 + 2.27 + 0.03) = 0.26. The measurements from the same students are at best weakly correlated.
What is the fraction of the variance that is due to within-subject variation? The fraction of the total variance due to within-subject variation is 6.55 / (6.55 + 2.27 + 0.03) = 0.74 or 74 percent of the total variance is due to within-subject variability. 2) What is the fraction of the variance that is due to within-school but between-subject variation? The fraction of the total variance due to within-school but between-subject variation is 2.27 / (6.55 + 2.27 + 0.03) = 0.25 or 25 percent of the total variance is due to between subject variability within a school. 3) And what is the fraction of the variance that is due to between-school variation? The fraction of total variance due to between-school variation is 0.03 / (6.55 +2.27 + 0.03) = 0.01 or 1 percent of the total variance is due to school to school variation.
Based on the calculation of the fraction of the different variance components, do you think it would be appropriate to simplify the model? Describe how you would simplify the model and also describe one graph/figure/table that you could have made to support your decision. There is only 1 percent of the total variance attributable to school to school differences; therefore, I would propose to drop the random school effect from the model. One graphical display that I would make is the following: make side-by-side boxplots of the raven’s scores across the schools (i.e. one boxplot for each school). In this figure, we may notice that the schools have different means/medians which depends on the treatment, but the spread of the data within each school is similar. An alternative figure is to fit the OLS regression from question 1 and get the residuals. These residuals have the treatment effects removed. At this time, make side-by-side boxplots of the residuals where each boxplot represents a school. Here again you should see that the spread in the residuals across the schools is very similar. We can also look at the AIC for this model compared to the model dropping the school random effect.
Model Selection Issues: Nested Models Model 1: Y_ijk = b0 + b1*calorie_i + b2*meat_i + b3*milk_i + u_i + u_ij + e_ijk Model 2: Y_ijk = b0 + b1*calorie_i + b2*meat_i + b3*milk_i + u_ij + e_ijk Removal of the random school effect is equivalent to testing H0: tau^2 = 0 • This is a non-standard test • Testing on the boundary • A likelihood ratio test is not applicable; produces p-values that are too large; resulting in decision to remove tau^2 when I may need it! • In some cases the test is a 50:50 mixture of 0 and chi-square(1), but not always • Some recommend inflating α (use 0.1 instead of 0.05)
Model Selection Issues: Non-Nested Models • AIC = -2 x maximized log likelihood + 2 x number of parameters, where that includes random effect variance parameters • BIC = -2 x maximized log likelihood + log(N) x number of parameters • Higher risk of selected a model that is too simple based on BIC since penalty for each additional parameter is large!
Missing Data • Missing completely at random (MCAR): missingness does not depend on observed data or the unobserved missing information • Observed data is a random sample of complete data • Use complete data; inferences are valid • Missing at random (MAR): missingness depends on the observed data but not on the unobserved missing information • Analysis based on complete data using a likelihood method produces valid inferences when the model for mean and covariance structure is correctly specified. • Random effects models are likelihood based • Non-ignorable missingness: missingness depends on the observed data and also on the values of the data that are not observed • Sensitivity analysis