Download
1 / 62
620 likes | 661 Vues
Pharmaceutical Industry Conduct. Pricing Does more intense competition drug prices? Promotion Does drug advertising promote or impede competition? Product innovation Are large firms necessary for drug innovation?

E N D
Pharmaceutical Industry Conduct • Pricing • Does more intense competition drug prices? • Promotion • Does drug advertising promote or impede competition? • Product innovation • Are large firms necessary for drug innovation? • Preview: Empirical evidence indicates that competition is at work, but the industry does not exhibit perfect competition.
Pricing Behavior • Can the brand-name firm maintain its price once its patent expires and generics enter? • After patent expiration, each 10% increase in the price differential for brand-name drugs relative to generics resulted in only a .5% drop in market share for the brand-name drug. (Hurwitz & Caves, 1988) • Average price differential between brand-name and generic firms = 127%, but brand name market share = 63.4%.
Pricing Behavior • The longer the brand-name drug’s effective patent length, the more market share it preserved after patent expiration. • The arrival of an additional supplier was estimated to reduce the brand-name drug’s market share by 1.25 percentage points.
Pricing Behavior • Branded drugs’ prices 11% 2 years after generic entry. (Grabowski & Vernon 1992) • Yet brand-name drugs lost 1/2 of market share. • Average market price fell to 79% of pre-entry price.
Pricing Behavior • Brand-name firms segment the market. • Remaining customers relatively price insensitive. • Inelastic demand curve allows them to maintain price. • These 2 studies suggest that generic drug prices are substantially lower than brand-name prices.
Promotion Strategies • Promotion Magnitude: • Research-based firms spend as much as 20-30% of sales on promotion. • 70% pharmaceutical salespersons (detailing). • 27% advertising. • 3% direct mail. • Impact: • 22,000 drugs on market timely, valuable information. • May impede competition.
Direct-to-Consumer PrescriptionDrug Advertising: Bane or Boon? Richard L. Kravitz, MD, MSPH UC Davis Center for Health Services Research in Primary Care
A brief regulatory history • 1981: industry shows interest in advertising directly to consumers • 1983–1985: FDA obtains voluntary moratorium on DTC advertising • 1985: moratorium lifted • 1990: DTC advertising begins in earnest • 1997: TV advertising made feasible through FDA policy change
Ads are read and acted upon • 56% of Sacramento-area adults have read a DTC ad carefully from beginning to end • 35% have asked their doctor for more information because of a DTC ad • 19% have asked for a prescription due to an ad
Misconceptions abound • 50% believe ads subject to prior review • 43% believe only “completely safe” prescription drugs can be marketed DTC; 21% that only “extremely effective” drugs can be so marketed • 22% believe that advertising of prescription drugs with serious side effects has been banned
The Industry Perspective “ By greatly increasing the likelihood that patients will seek help for their medical problems and receive a safe and effective prescribed medicine, DTC advertising will…play a very real role in enhancing public health.” -Alan F. Holmer, President, Pharmaceutical Research and Manufacturers of America, JAMA 281:380,1999
A Contrarian View “Extending the scope of already ubiquitous promotions about ‘post-nasal drip,’ ‘unsightly rashes,’ or ‘cures for baldness’ has little to do with educating patients or relieving suffering. It will, however, inevitably drain healthcare dollars, dramatically increase unnecessary prescribing, and strain patient-doctor relationships.” --JR Hoffman and MS Wilkes, BMJ 318:1301, 1999
Content analysis of print ads • All DTC ads appearing from 1989 through 1998 in 18 popular magazines • Selection of publications based on circulation
Influence on prescribing decisions: a bi-national study • Cross-sectional cluster survey in Sacramento (CA) and Vancouver (CANADA) • 78 primary care physicians • 1431 patients (61% of those attending on preset clinic days)
Patient requests and physician prescribing • Patients requested prescriptions in 12% of visits (MD report) • 42% of requests were for advertised products • 74% of those requesting drugs received them (similar for advertised and non-advertised drugs) • Patients requesting a prescription much more likely to receive one (AOR 8.7, 95% CI 5.4-14.2)
Provoking clinical ambivalence • “If you were treating another similar patient with the same condition, would you prescribe this drug?” • Percent “possibly” or “unlikely” • Rx not requested: 13% • Any drug requested: 49% • Advertised drug requested: 70%
Summary of Katz Studies • DTC ads are reaching consumers • Education is a side effect of promotion • DTCA-induced requests influence prescribing • A true reckoning of public health benefits and harms has not occurred
Product Innovation www.phrma.org
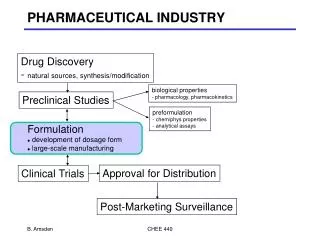
Product Innovation • Innovation is very risky and time consuming. • R&D process takes many years. • Only a small fraction of new drug discoveries are eventually marketed. • 75% of NCEs in Phase 1 go to Phase 2. • 36% of NCEs in Phase 1 go to Phase 3.
Capitalized Cost perApproved Drug • R&D costs are capitalized to the date of marketing approval • The cost-of-capital is based on a CAPM analysis of the pharmaceutical industry • An 11% real cost-of-capital was utilized for the period under study
Out-of-Pocket and Capitalized Costsper Approved Drug 802 466 403 336 282 121 J. DiMasi, R. Hansen, and H. Grabowski, “The Price of Innovation: New Estimates of Drug Development Costs”, Jan 2002
Important Institutional Features of Pharmaceutical R&D • Estimated mean R&D cost per new chemical entity estimated to be US$802 million (2000$). (DiMasi, Hansen, and Grabowski 2003) • Long time involved in developing new drug • High failure rates in drug discovery and development
Patents to Promote Investments in R&D • What is a patent? • Conceptually, how do patents promote R&D? • Why do you think patents are used much more widely than are other public policies to promote pharmaceutical R&D?
Effective Patent Life (EPL) • EPL=Nominal Patent Life – Time Lost Prior to Regulatory Approval • Nominal Patient Life now fixed at 20 years • Priority review can increase EPL by a year (Ridley, Grabowski, Moe 2006) • Passage of Hatch-Waxman Act increased EPL by 2.3 years (Grabowski and Vernon 2000)
Urban Consumer Price Inflation Rates Year All Items Prescription Drugs* 1970-79 7.1 3.6 1980-89 5.6 9.6 1990-94 3.6 6.9 1995 2.8 1.9 2000 3.4 4.4 2003 2.3 3.1 2005 3.4 3.5 2007 2.8 1.4 2008 3.8 2.5 Pharmaceutical Industry Performance Does the absence of perfect competition higher prices & restricted output? *2000 - 2005 includes prescription drugs and medical supplies.
Cautionary note on inflation • The inflation rate calculated by BLS is based on a price index, which may overstate the true in drug costs. • Price index • the relative cost of purchasing a fixed “basket” of drugs in year t, vs. the costs of same basket in a base period. Price Indext =
Cautionary note on inflation • BLS “basket” undersamples new drug products, which generally have smaller price increases than older drugs. • BLS treats generics as new products, not as substitutes for more expensive drugs. • BLS uses list rather than transactions prices. • BLS doesn’t adjust prices to reflect quality improvements.
Return on Assets for Pharmaceutical Companies in the Fortune 500 2008 Profits Rank Company as % of Assets 29 Johnson & Johnson 46 Pfizer 80 Abbott Laboratories 103 Merck 110 Wyeth 120 Bristol-Myers Squibb 122 Eli Lilly 138 Schering-Plough 168 Amgen Are profits in the drug industry “too high?” 15.2 7.3 11.5 16.5 10.0 17.8 -7.1 6.8 11.5 The Pharmaceutical industry ranked 3 out of 53 industries with an ROA of 11.5.
Are profits in the drug industry too high? • Under standard accounting practices, R&D is written off as a current expense. • But R&D affects revenues for years to come. • Rate of return on investment is calculated using an asset base that improperly excludes intangible R&D. • Should capitalize R&D outlays & depreciate them over appropriate time periods. • Accounting figures overstate the rate of return on assets for drug companies.
Drug payment (Medicare) • Since 2006, Medicare offers Part D (plans for pharmaceuticals) • Deduction +Copayment
Drug payment (Germany) • Fee for services • Free pricing • Copayment (10%), Min (5 euros), Max (10 euros)
Drug payment (England) • Fee of services • Free pricing but control the profits for brand product • Clawback: discount according to the quantity of use • Approximately 5.63%-13.2%(2006.9.1) 。 • Copayment :fixed (per drug item: £6.5, but no copayment for 85% of drugs)
Drug payment (Japan) • Fee for services • Standard for drug payment • Copayment
Drug payment (Korea) • Fee for services • NHI agency sets up the upper limit for drug payment • Drug payment is set according to the average transaction price (ATP) in the last quarter • Co-payment (30-50%)
Drug Payment (Taiwan) • Fee for services • NHI agency sets up the reimbursement price for drug payment • Standard of drug payment。 • Package payment EPO( hemo-dialysis treatment) • Daily Payment Clinics 25/50/75, Chinese Medicine 30/60/85 • DRGs
Drug Payment (Taiwan) • Co-payment 10-20% (cap at NT200) • 80% of outpatient visit do not need to bear copayment • Conditions for no copayment • Catastrophic illness • Mountainous area • Drug payment less than 100 • Chronic illness • Case payment
How to set up the standard of drug payment? • Market • Average transaction prices • Regulated prices
Transaction prices Upper limit Transaction prices =payments ΔM=Transaction prices -costs (profits) Payments No change in drug expenditure, just transfer the margins to drug companies Price differences
Transaction prices—Korea’s experience • Since 1977, Korea used the standard of drug paymenmt for reimbursement price. Starting from 1999, the standard changed to average transaction price (ATP) 。 • ATP regulates the upper limit of each drug. The drug payment is calculated according to a weighted average of drug price. • At the start of ATP, the price of drugs reduces by 30.7% 。 • Now the ATP is approximately 99.56% of the upper limit