Download
1 / 41
410 likes | 418 Vues
Data Access and Associated Tools: New MapServer Interface to the JGOFS/GLOBEC Data Management System. Presentation to the U.S. GLOBEC Pan-Regional Workshop 29 November 2006 Bob Groman. Make project data available on-line Hunting the data and information down Quality control

E N D
Data Access and Associated Tools: New MapServer Interface to the JGOFS/GLOBEC Data Management System Presentation to the U.S. GLOBEC Pan-Regional Workshop 29 November 2006 Bob Groman
Make project data available on-line Hunting the data and information down Quality control Find and document the metadata Add data to the JGOFS/GLOBEC system Data are freely available; must abide by data acknowledgment policy Data Management Office
Data Management Office • Facilitate data access and synthesis • JGOFS/GLOBEC data management system • Data objects • Directory structure • Download capability • Simple X-Y plotting • Distributed data servers • Software is open source, freely available • DIF records submitted to the Global Change Master Directory
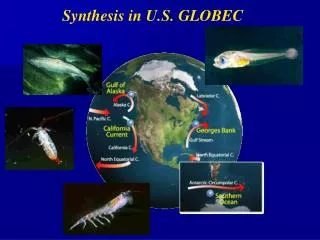
Data Sets On-LineBiological, Chemical, and Physical Oceanographic Measurements Georges Bank: 778+ Northeast Pacific: 437+ Southern Ocean: 157+
Dissemination to scientific investigators on a timely basis Available when "useful" Available to others outside the program Key Data Policy Characteristics
New DMO Efforts • Implementing a geographical user interface to • JGOFS/GLOBEC and additional features needed to • improve interoperability with other data systems • Geospatial (MapServer) interface • XML encoding of metadata • Open Geospatial Consortium access • Web Mapping Service (WMS) • Web Feature Service (WFS)
EasyKrig Application EasyKrig3.0 2D and 3D Kriging application using Matlab Think of it as contouring on steroids.
GeoZui3D with Matlab Data Preparation GeoZui3D* Professor Colin Ware Director Data Visualization Laboratory Center for Coastal and Ocean Mapping, UNH MATLAB conversion and formatting programs to provide the JGOFS/GLOBEC data to GeoZui3D * http://www.ccom.unh.edu/vislab/GeoZui3D/
Supports all web browsers Distributed servers for ASCII and image data using httpd protocol Simple, list oriented interface with basic X-Y plotting capabilities http://globec.whoi.edu/ JGOFS/GLOBEC uses a text based interface
http://globec.whoi.edu/map MapServer
Graphing temperature versus depth at two different stations.