Download
1 / 14
140 likes | 250 Vues
Fine structure of all-particle energy spectrum in the knee region. A Garyaka 1 , R Martirosov 1 , S Ter-Antonyan 3 , H Babayan 2 , A Erlykin 4 , Y Gallant 5 , L Jones 6 , J Kempa 8 , N Nikolskaya 4 , B Pattison 9 ,

E N D
Fine structure of all-particle energy spectrum in the knee region A Garyaka1, R Martirosov1, S Ter-Antonyan3, H Babayan2, A Erlykin4, Y Gallant5, L Jones6, J Kempa8, N Nikolskaya4, B Pattison9, J Procureur7, S Sokhoyan1 and H Vardanyan1
1Alikhanyan National Laboratory-Yerevan Physics Institute , Yerevan, Armenia • 2State Engineering University of Armenia, Yerevan, Armenia • 3Southern University, Baton Rouge, LA, USA • 4Lebedev Physical Institute, Russian Academy of Sciences, Moscow, Russia • 5Laboratoire Univers et Particules de Montpellier, Montpellier, France • 6Department of Physics, University of Michigan, Ann Arbor, USA • 7Centre d’Etudes Nucleaires de Bordeaux-Gradignan, Gradignan, France • 8Warsaw University of Technology, Faculty of Civil Engineering, Mechanics and Petrochemistry in Plock, Poland • 9CERN, Switzerland
Introduction • All-particle energy spectrum derived from Extensive Air Showers (EAS) measurements in the knee region (~3 PeV) is one of information sources about the origin, energetics and propagation of primary nuclei in the Galaxy. A lot of experiments performed in the last decades [1-9] unambiguously pointed out to the existence of a fine structure of energy spectrum behind the knee energy region (10 -100 PeV) unaccounted for by the standard rigidity-dependent Peters model [10]. The additional polar cap component proposed by Stanev et al, [11] , Local Cosmic Ray Sources recently worked out by the Erlykin and Wolfendale [12] or our 2-component (Galactic and Fe-component from nearest pulsar) model [6] can interpret the obtained spectral fine structure in the frames of model uncertainties and measurement errors. Herein, we present the updated all-particle energy spectrum measured by the GAMMA facility during 2003-2009 runtime. Mountain location of the GAMMA experiment (700 g/cm2) provides the highest level of correlation of primary energy with detected shower particle flux (0.98-0.99) and along with 2-component ( muons with energy E>5 GeV, and total charge particles) shower measurements significantly decreases the uncertainties of spectral reconstruction.
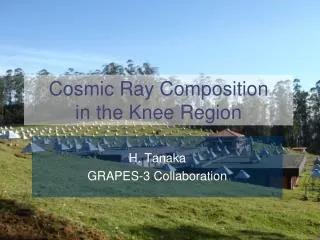
GAMMA array GAMMA is a ground-based EAS array to measure the muon and the electromagnetic components of the EAS [6, 13-14]. It consists of array of 33 surface detection stations and underground muon detectors, located at the southern side of Mount Aragats in Armenia. The layout of the array is shown in figure 1; each station contains 3 plastic scintillation detectors with dimension of 1x1x0.05 m3. Each of the central nine stations contains (the 4th) additional small detector with dimensions of0.3x0.3x0.05 m3 for high particle density (>>103 m−2) measurements. In addition recently 8 separate detectors were placed to make the central part denser.
The muon carpet is composed of 150 scintillation detectors which are compactly arranged in the underground hall under the2.3 kg/cm2 of rock and concrete. The layout of the carpet is shown in figure 2. Dimensions of scintillator, casings and photomultipliers are the same as in the surface detectors. The arrangement of the muon detectors gives the possibility of determining the muon lateral distribution function up to 60m from the EAS core at Eµ > 5GeV.
The reconstruction of the EAS size (Nch), shower age (s) and core coordinates (x0,y0) is performed based on the Nishimura-Kamata-Greisen (NKG) approximation to the measured charged particle densities. Angular coordinates of the shower axis (θ,φ) are derived by time delays between various stations. The GAMMA detector response and measurement error are taken into account. Details are expanded in [6]. Indirect characters of study of the primary high energy all-particle flux by EAS method require estimating primary energy with shower parameters regardless of primary nuclei. • The multi-parametric event-by-event method of reconstruction of the primary all-particle energy spectrum was worked out by S.V. Ter-Antonyan and presented in [6] in detail. The unbiasedenergy estimator E1(Nch,N,s,cos) of the primary energy E0 regardless of primary nucleus was obtained using the CORSIKA EAS simulation code [15] with the SIBYLL [16] interaction model for H, He, O and Fe primary nuclei taking into account the response of GAMMA detectors and reconstruction uncertainties of EAS parameters [6]. • The EAS data set analyzed in this paper has been obtained for 8.46 × 10⁷ s of live runtime of the GAMMA facility, from 2003 to 2009. We reconstructed the primary energy spectrum using unbiased (<5%) event-by-event primary energy evaluations regardless of primary nucleus and parameterized solutions of corresponding inverse problem [6].
In the Figure 3 we presented our spectrum in comparison with world data from (cited in the top-down order of the figure) [9, 8, 7, 13, 2, 3, 16-18]. To explain the observed bump in the 70-80 PeV energy region we considered an additional (pulsar) Fe components with flat power law energy spectrum (γ1p ~ 1±0.5) before the cut-off energy [6]. Yakutsk within the energy range (5−8)×1016 eV there is a small peak generated by iron nuclei. Then it follows that the nature of the peak in the spectrum is related to a heavier component of cosmic rays. Figure 3. GAMMA all-particle energy spectrum in comparison with data of other experiments taken from [9, 8, 7, 13, 2, 3, 18-20] (in top-down order of the figure). GAMMA 12 represents our data of 2003-2009 years.
The average logarithm of primary nuclei mass number as a function of energy is shown in figure 4 in case of hypothesis of a two (Galactic and pulsar) component origin of the observed cosmic ray flux. It is seen that the two-component model predicts a more rapid growth which is in accordance with recent experiments (see [ 21]). Conclusion The high accuracy of energy evaluations and small statistical errors point out the existence of an irregularity (‘bump’) in the 60–80 PeV primary energy region. The bump can be described by a two (Galactic and pulsar) component model of the primary cosmic ray origin. Figure 4. Average logarithm primary nuclei mass number derived from rigidity-dependent primary energy spectra [13] (dashed line) and 2-component model prediction [6] taking into account additional pulsar component (solid line).
LnE0=a1*x+a2*√s/c+a3+a4*c+a5/(x*a6*y)+a7*y*exp(s) Where x=lnNe, y=lnNμtr, c=cosθ, s – shower age a1 a2 a3 a4 a5 a6 a7 1.030 3.641 −5.743 2.113 6.444 1.200 −0.045