1 / 11

Fig. 1

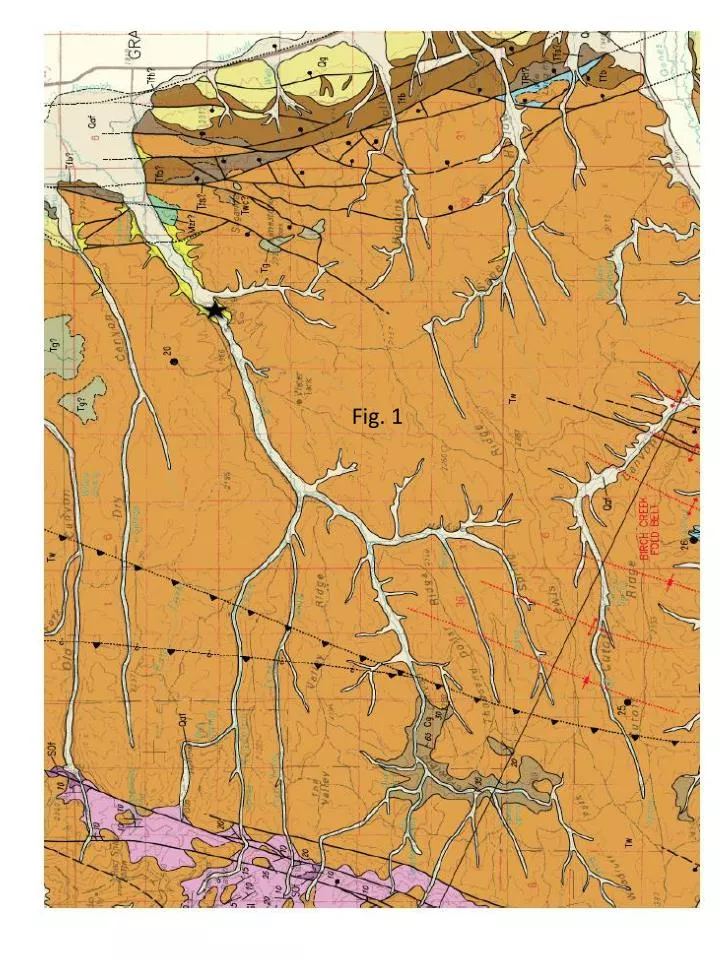
Fig. 1. Fig .2. Fig.3. Fig .4. Fig .5. Fig .6. Fig. 7. Snowmelt. T-storms. Fig. 8. Fig. 9. Peak. Mean Annual flow. Fig. 10. 2-yr flood 56 cfs. 10-yr flood 132 cfs. Fig 11. Fig 12. Fig 13. Table 1. Rating relation data for Rating number 11. Fig. 14.

jed
Télécharger la présentation

Fig. 1

An Image/Link below is provided (as is) to download presentation Download Policy: Content on the Website is provided to you AS IS for your information and personal use and may not be sold / licensed / shared on other websites without getting consent from its author. Content is provided to you AS IS for your information and personal use only. Download presentation by click this link. While downloading, if for some reason you are not able to download a presentation, the publisher may have deleted the file from their server. During download, if you can't get a presentation, the file might be deleted by the publisher.

E N D

Presentation Transcript


  1. Fig. 1

  2. Fig.2 Fig.3 Fig.4

  3. Fig.5 Fig.6

  4. Fig. 7 Snowmelt T-storms Fig. 8

  5. Fig. 9 Peak Mean Annual flow Fig. 10 2-yr flood 56 cfs 10-yr flood 132 cfs

  6. Fig 11.

  7. Fig 12. Fig 13.

  8. Table 1. Rating relation data for Rating number 11

  9. Fig. 14

  10. Table 2. Coordinates of benchmarks near the Big Creek Gage

  11. Fig. 15

More Related