Download
1 / 23
230 likes | 426 Vues
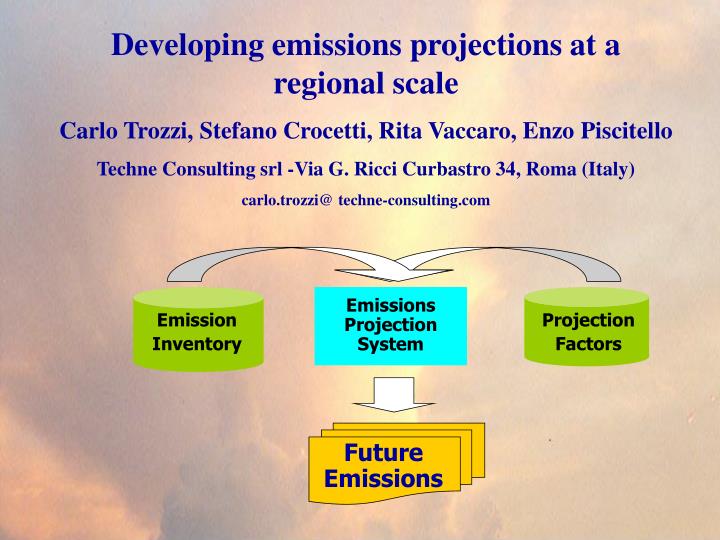
Emissions Projection System. Emission Inventory. Projection Factors. Future Emissions. Developing emissions projections at a regional scale Carlo Trozzi, Stefano Crocetti, Rita Vaccaro, Enzo Piscitello Techne Consulting srl -Via G. Ricci Curbastro 34, Roma (Italy)

E N D
Emissions Projection System Emission Inventory Projection Factors Future Emissions Developing emissions projections at a regional scale Carlo Trozzi, Stefano Crocetti, Rita Vaccaro, Enzo Piscitello Techne Consulting srl -Via G. Ricci Curbastro 34, Roma (Italy) carlo.trozzi@ techne-consulting.com
Background • in the last year new European Union (EU) air quality directives have been introduced • the Directives requires Member States to divide their territory into zones related to air quality standards • the directives requires Member States to adopt plan and programs inside zones when air quality standards are not respected
Topics • EU legislation and prescription for regional plan and program for air quality management • methodologies and software used in regional and local level emissions projections • differences and synergies of national, regional and “zone” projection • detailed methodology • case studies
EU air quality standards • limit value, a level fixed with the aim of avoiding, preventing or reducing harmful effects on human health and/or the environment as a whole • alert threshold, beyond which there is a risk to human health from brief exposure • margin of tolerance, the percentage of the limit value by which this value may be temporarily exceeded • upper (lower) assessment threshold, below which a combination of measurements and modeling techniques (modeling or objective-estimation techniques alone) may be used to assess air quality
Preliminary Air quality assessment Definition of zones and agglomerations Assessment of ambient air quality requirements Plan and programs EU legislation procedure
Air quality assessment Emission Inventory & Models Measurement Definition of zones and agglomerations Assessment of ambient air quality Zones wherelevels are between lower and upper assessment threshold Agglomerations (>250.000 inhabitants) and Zones where levels exceed upper assessment threshold Zones where levels are below the lower assessment threshold
plan or programme Plan and programs zones and agglomerations in which the levels of one or more pollutants are: higher than the limit value plus the margin of tolerance below the limit values • maintain the levels of pollutants below the limit values • preserve the best ambient air quality, compatible with sustainable development attaining the limit value within the specific time limit
Regional, National & EC planning Measures at EC scale National Plans Local effects of measures at EC or national scale Measures at national scale Specific measures inside zones Regional Plans
Regional Plans National vs Regional National general activity trend technologies trend & national measures main point sources trend Specific trend inside zones Specific measure on smaller point sources inside zones Specific measures for lines and area inside zones
Scenario definition in Emissions Projection System Projection Drivers Emission Inventory Area emissions inside zones Line emissions inside zones Future Emissions National point sources emissions Minor point sources emissions Model
Projection drivers: activity aα = Vαk / Vα0 Vα0 (Vαk) activity levels at base (at future) year examples: • population, gross domestic product • agricultural production, waste production • number of road vehicles, number of takeoff/landing • tons of freight transported by road and sea • specific reduction of miles in zone by traffic limitation • specific reduction of miles in zone by fuel limitation • specific modification of single Point and Line sources activities
Projection drivers: technology (EFs) fβ = Vβk / Vβ0 Vβ0 (Vβk) parameters which affect emission at base year (at future year) examples: • sulphur content of fuels • new regulation limits on emissions from point sources and mobile sources • solvent content of products (paints, inks, glues, etc.) • application of Best Available Technologies – BATs at regional or single sources level • application of Best Available Practices – BAPs at regional or single sources level
Scenarios definition • activity scenarios defined associating to selected activities, specific activity drivers at regional, zone, line and units of point source level • technology scenarios defined associating to selected activities and pollutants, specific technology drivers at regional, zone, line and units of point source level • emissions scenarios obtained as combination of activity, technology and point sources scenarios
Area emissions Eijkz = Eij0z aa fa ab fb+ dEijkz Area emissions Eijkz of pollutant j at year k, in zone z, for the activity i are evaluated from emissions at base year Eij0z and: • driver for regional activity indicators projection aa • driver for regional emission factors projection fa • driver for zone activity indicators projection ab • driver for zone emission factors projection fb • aditional emissions dEijkz for new absolute contribution (new activities in some zones)
Point emissions Eijkup = Eij0up aa fa ab fb+ dEijklup Point sources emissions Eijkp of pollutant j at year k, of unit u of source p, for the activity i are evaluated from emissions at base year Eij0p and: • driver for regional activity indicators projection aa • driver for regional emission factors projection fa • driver for unit activity indicators projection ab • driver for unit emission factors projection fb • aditional emissions dEijkup for new absolute contribution (new units, new plants)
Line emissions Eijkl = Eij0l aa fa ab fb+ dEijkl Line emissions Eijkl of pollutant j at year k, on line l, for the activity i are evaluated from emissions at base year Eij0l and: • driver for regional activity indicators projection aa • driver for regional emission factors projection fa • driver for line activity indicators projection ab • driver for line emission factors projection fb • additional emissions dEijkl for new lines (for examples new transport infrastructures)
Bolzano Trento Friuli-Venezia Giulia Toscana Umbria Liguria Basilicata Campania Sicilia Regional case studies in Italy
Conclusion • A specific methodology is required for evaluate emissions reduction scenarios at zones level in the frame of EU air quality directive plan and program • The methodology is complementary to European and National level planning • A specific tool are developed for zone emission projection • Methodology and tool are used in regional planning in Italy in the last years