Download
1 / 36
360 likes | 371 Vues
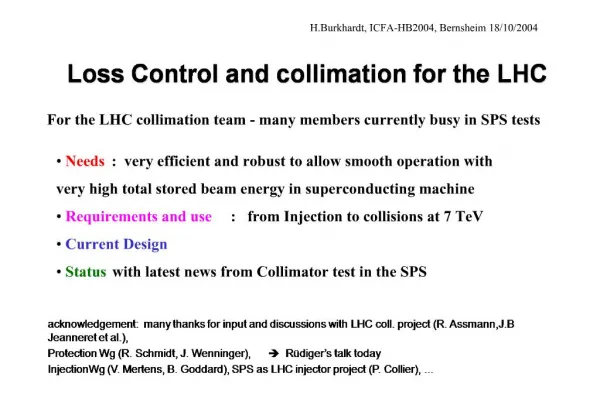
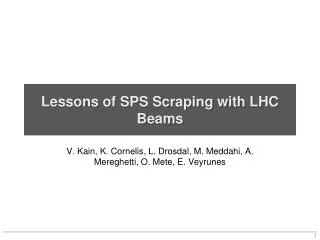
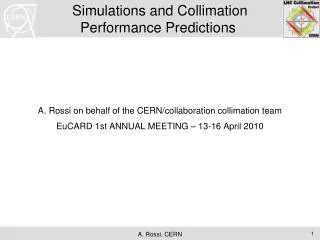
The 4th International Particle Accelerator Conference, IPAC13 May 13 th -17 th , 2013 Shanghai, China. Simulations and measurements of collimation cleaning with 100MJ beams in the LHC.

E N D
The 4th International Particle Accelerator Conference, IPAC13 May 13th-17th, 2013 Shanghai, China Simulations and measurements of collimation cleaning with 100MJ beams in the LHC • R. Bruce, R.W. Assmann, V. Boccone, C. Bracco, M. Cauchi, F. Cerutti, D. Deboy, A. Ferrari, L. Lari, A. Marsili, A. Mereghetti, E. Quaranta, S. Redaelli, G. Robert-Demolaize, A. Rossi, B. Salvachua, E. Skordis, G. Valentino, T. Weiler, V. Vlachoudis, D. Wollmann • CERN, Geneva, Switzerland
Outline • Introduction • Cleaning simulation setup • Comparison with measurements • Advanced simulations • Conclusions
Superconducting coil: T = 1.9 K, quench limit ~ 15mJ/cm3 Proton beam: 145 MJ (design: 362 MJ) Factor 9.7 x 10 9 Aperture: r = 17/22 mm Introduction LHC “Run 1” 2010-2013: No quench with circulating beam, with stored energies up to 70 times of previous state-of-the-art!
Simulations presented here refer to the 2011 LHC machine configuration. Cleaning for the “relaxed collimator settings”. Some numbers from 2011-12 operation Stored beam energy Beam 1 Beam 2 R. Bruce
1.0m+0.2m tapering The LHC collimator BEAM
LHC collimation system layout Two warm cleaning insertions, 3 collimation planes IR3: Momentum cleaning 1 primary (H) 4 secondary (H) 4 shower abs. (H,V) IR7: Betatron cleaning 3 primary (H,V,S) 11 secondary (H,V,S) 5 shower abs. (H,V) Local cleaning at triplets8 tertiary (2 per IP) Momentum cleaning IR3 Betatron cleaning IR7 Passive absorbers for warm magnets Physics debris absorbers Transfer lines (13 collimators)Injection and dump protection (10) Total of 108 collimators (100 movable). Two jaws (4 motors) per collimator! Picture by C. Bracco
Outline • Introduction • Cleaning simulation setup • Comparison with measurements • Advanced simulations • Conclusions
LHC collimation: simulation challenges • Model precisely the complex and distributed collimation system → 44 collimator per beam along 27 km; multi-stage cleaning; → 2 jaw design for 3 collimation planes: horizontal, vertical and skew; → impact parameters in the sub-micron range; → beam proton scattering with different collimator materials. • Collimation is designed to provide cleaning efficiencies > 99.99% → need good statistical accuracy at limiting loss locations; → simulate only halo particles that interact with collimators, not the core.
LHC collimation: simulation challenges • Model precisely the complex and distributed collimation system → 44 collimator per beam along 27 km; multi-stage cleaning; → 2 jaw design for 3 collimation planes: horizontal, vertical and skew; → impact parameters in the sub-micron range; → beam proton scattering with different collimator materials. • Collimation is designed to provide cleaning efficiencies > 99.99% → need good statistical accuracy at limiting loss locations; → simulate only halo particles that interact with collimators, not the core. • Detailed description of the LHC aperture all along the 27 km → 10 cm binning, i.e. 270000 check points. • Accurate tracking of particles with large orbit and energy deviations → need state-of-the-art tracking tools. • At the scale of 7 TeV beam sizes (~200 microns), small errors matter! Need to model the relevant imperfections → Jaw flatness of the order of 40 microns; → Jaw positioning (gap/angles); → Machine optics and orbit errors.
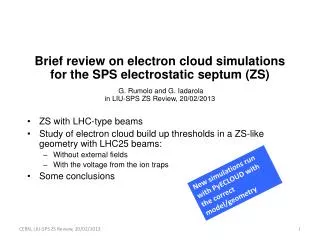
Collimator jaw Incoming halo particle An illustrative scheme Simulation tools All combined in a simulation package for collimation cleaning studies: G. Robert-Demolaize, R. Assmann, S. Redaelli, F. Schmidt, A new version of SixTrack with collimation and aperture interface, PAC2005
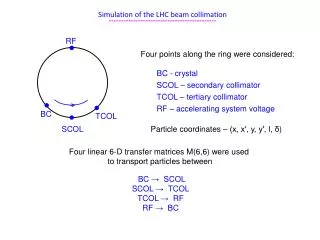
IR8 Interpolation: ∆s=10cm (270000 points!) Trajectory of a halo particle Magnet locations : ∆s ≤ 100m Example: trajectory of a halo particle ∆s=10cm A dedicated aperture program checks each halo particle’s trajectory to find the loss locations.
Example of simulated “loss map” Nominal 7 TeV case, perfect machine Statistics for a typical case: 20-60 million protons, 200 turns. Up to [5.4x10⁶m] x [60x106p] = 3.24 x10¹⁴ m = 0.034 lightyears for one high-statistics simulation case!
Machine aperture misalignments Collimator jaw flatness In addition, all optics and multipole errors well established for the standard MADX / sixtrack interface can be applied. Collimator positioning with respect to the beam Closed-orbit errors around the ring Jaw volume Can apply random errors to collimator geometry. Typical RMS values: Collimator centre = 50μm Gap = 0.1 σ Jaw tilt angle = 200 μrad Design value: +/- 3-4mm peak-to-peak 5th order polynomials to fit measured flatness of all Carbon collimators: ≥ 40 μm Error models for cleaning simulations
Outline • Introduction • Cleaning simulation setup • Comparison with measurements • Advanced simulations • Conclusions
Betatron cleaning at 3.5TeV, β*=1.5m Betatron Beam 1 Dump TCTs Off-momentum 0.00001 TCTs TCTs Legend: Collimators Cold losses Warm losses 0.000001 Beam losses increased artificially: crossing 3rd order resonance or white noise from damper. Local cleaning calculated as ratio of local BLM signal to highest loss at the primary collimators.
Collimation cleaning in 2010-12 B. Salvachua et al., MOPWO049 • The loss maps are regularly performed to validate the system functionality.Shown here: cleaning at the highest COLD loss location of the ring (DS in IR7) • Excellent stability of cleaning performance observed!Steps in the graph determined by changes of collimator settings. • However, a certainspread in measurements for the “same” configuration adds uncertainty to the measurements, to betaken into account in the coparison. • In the following, use average of several loss maps done in 2011(7 cases that should give the same cleaning).
Comparison - full ring at 3.5 TeV Simulations Measurements Excellent qualitative agreement: all critical loss locations identified. Note 7 orders of magnitude on y scale! R. Bruce
Losses in dispersion suppressor: limiting location Cross-talk on BLM signal from upstream losses Comparison in the betatron cleaning Simulations Measurements REMINDER: we are comparing measured BLM signal against losses in the collimators or protons touching the aperture ! R. Bruce Note the y scale!
SixTrack results summed over 2m interval upstream of each BLM in the IR7 DS For TCTs, dividing losses at TCP by losses at TCT Measured: 2011 average, normalized to TCP Signal at selected loss locations (B1,H) Measured BLM signal Simulated protons on aperture or TCT jaws R. Bruce Additional step: simulate deposited energy from hadronic showers, accounting for 1. Error models affecting collimation 2. Local geometry and BLM layout 3. Collimator materials 4. Details of impact parameters Limiting cold locations at the dispersion suppressor in IR7 Tertiary collimators at high-luminosity experiments, relevant for background
Energy deposition and BLM response Improved normalization of the BLM for cleaning estimates takes into account TCP response on incoming beam losses. E. Skordis for the FLUKA team Modelling the local BLM geometry - never identical - and collimator material crucial for final results! 19
Improved estimates R. Bruce, E. Skordis Note: Simulation sources: protons impinging on a few tens of microns on TCP surface. Simulation output: energy deposited in a 50 cm long BLM at 500 meters from the source!
Comparison at the tertiary collimators Measurements underestimated by factor 1.5-4! Note that background beam losses are not taken into account. R. Bruce, E. Skordis
Outline • Introduction • Cleaning simulation setup • Comparison with measurements • Advanced simulations • Conclusions
E. Quaranta et al., MOPWO038 E. Quaranta et al., MOPWO037 L. Lari et al., MOPWO046 D. Mirarchi et al., MOPWO035 A. Marsili et al., MOPWO041 V. Previtali et al., MOPWO044 CLEANING INEFFICIENCY OF THE LHC COLLIMATION SYSTEM DURING THE ENERGY RAMP: SIMULATIONS AND MEASUREMENTS SIMULATIONS AND MEASUREMENTS OF BEAM LOSSES AND THE LHC COLLIMATORS DURING BEAM ABORT FAILURES NUMERICAL SIMULATION OF A HOLLOW LENS AS A SCRAPING DEVICE FOR THE LHC SIMULATIONS AND MEASUREMENTS OF PHYSICS DEBRIS LOSSES AT THE 4 TEV LHC LAYOUTS FOR CRYSTAL COLLIMATION TESTS AT THE LHC SIXTRACK SIMULATION OF OFF-MOMENTUM CLEANING IN LHC Advanced collimation simulations: reports at IPAC13
Conclusions • Presented simulations and measurementsof collimation cleaningfor the 3.5 TeV LHC (2011 run). • Anexcellent qualitative agreementis found when loss locations along the 27 km ring are considered. Most critical loss locations predicted by simulations are confirmed. Great success for the design of the collimation system! • Presented a first attempt tocomparequantitativelysimulations and measurements. This required energy deposition studies (FLUKA). Measurements at critical locations are reproduced within factors 1.5-4.0 when imperfections and details of local layouts are taken into account. • Proton losses can be predicted very well - we are confident that our tools are ready for LHC upgrade challenges. • Development of tools continues to addressnew simulation setups: hollow e-lens, fast failures, crystal collimation, cleaning during energy ramp, physics debris cleaning,...I encourage to visit our posters on these topics!
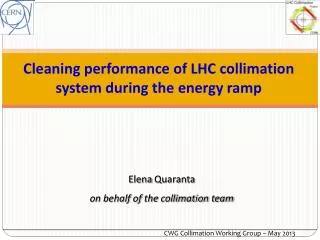
Cleaning during 4 TeV energy ramp • Simulation challenges: • Modelling physics of p-collimator interaction at different energies. • Implementation of different collimator gaps. • Measurement challenges: • Controlled losses of individual bunches at selected energies. • Balance losses: good cleaning accuracy versus risk of dumping. • Important to address scaling of models to unknown energy ranges above 4 TeV → dedicated beam tests in 2012 during 4 TeV energy ramp Collimator settings in [mm] Collimator settings [mm] E = 4000 GeV Intensity B1 Beam energy / intensity Intensity B2 E = 450 GeV Time [hh:mm] Very good agreement - note the 6 orders of magnitude on y scale! E. Quaranta et al., MOPWO038 Thanks to the ADT team for controlled losses.
Fast failures and collimator errors Time-dependent profile of the dump kicker rising field implemented to address beam losses in case of asynchronous beam dumps. Promising comparison with beam data. L. Lari et al., MOPWO046
The particle loses energy through synchrotron radiation and, sooner or later, it will hit the collimator jaw stable motion inside RF bucket NB: to better show the effects, the energy loss was increased by a factor 1.5∙103 IR3 unbounded motion outside RF bucket Outlook - Momentum cleaning Particles outside the RF bucket lose energy due to synchrotron radiation emission and are lost on the primary collimators in IR3. Primary source of losses in IR3 at 7TeV. Modelled for the first time. E. Quaranta et al., MOPWO037
Crystal - layout 1 Crystal - layout 2 Crystal-collimation cleaning Crystal routine benchmarked with SPS beam data (UA9) Standard collimation D. Mirarchi et al., MOPWO035+THPFI064
Simulations Measurements Simulations of physics debris losses SixTrack simulations Measured losses: ratio TCLout/TCLin IR1 TCL collimators in IR1/5: catch physics debris losses and protect the matching sections. We track for many turns the protons that experience collisions (distributions generated with FLUKA). A. Marsili et al., MOPWO041
Beam Beam Comparison at the CERN-SPS (i) ↓collimator ↓collimator Measurements Simulations Overall loss pattern along the full ring is correctly predicted! ➘Main losses immediately downstream of the collimator ➘Next significant peak at an SPS collimator, >2.5km downstream!
Difference understood if details of BLM mounting are taken into account! We can nicely simulate losses but, of course, cannot measure without BLM’s! 1st peak:TIDP 2nd peak:TIDV The peak is downstream of the BLM location! Measurements Simulations
Different shower development Carbon composite for primary collimators Tungsten for tertiary collimators: higher Z cause showers to be more contained in collimator volume → larger BLM signal E. Skordis