Download
1 / 16
160 likes | 250 Vues
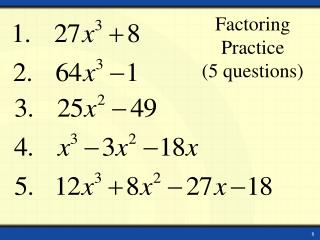
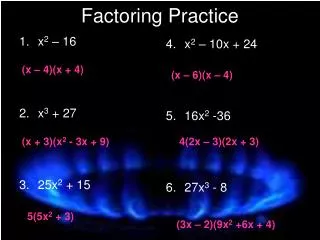
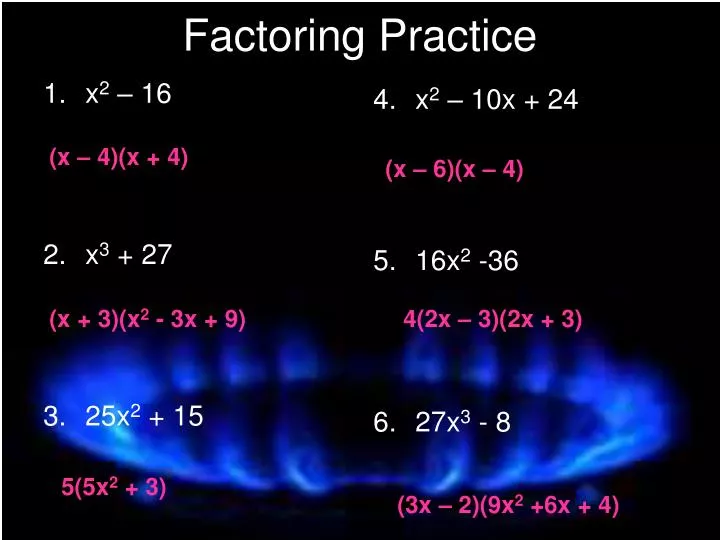
x 2 – 16 x 3 + 27 25x 2 + 15. x 2 – 10x + 24 16x 2 -36 27x 3 - 8. Factoring Practice. (x – 4)(x + 4). (x – 6)(x – 4). (x + 3)(x 2 - 3x + 9). 4(2x – 3)(2x + 3). 5(5x 2 + 3). (3x – 2)(9x 2 +6x + 4). 5.2 Graphing Simple Rational Functions. p. 310

E N D
x2 – 16 x3 + 27 25x2 + 15 x2 – 10x + 24 16x2 -36 27x3 - 8 Factoring Practice (x – 4)(x + 4) (x – 6)(x – 4) (x + 3)(x2 - 3x + 9) 4(2x – 3)(2x + 3) 5(5x2 + 3) (3x – 2)(9x2 +6x + 4)
5.2 Graphing Simple Rational Functions p. 310 What is the general form of a rational function? What does the h & k tell you? What does the graph of a hyperbola look like? What does the graph of ax+b/cx+d tell you? What information does the domain & range tell you?
Rational Function • A function of the form where p(x) & q(x) are polynomials and q(x)≠0.
Hyperbola x=0 • A type of rational function. • Has 1 vertical asymptote and 1 horizontal asymptote. • Has 2 parts called branches. (blue parts) They are symmetrical. We’ll discuss 2 different forms. y=0
Hyperbola (continued) • One form: • Has 2 asymptotes: x=h (vert.) and y=k (horiz.) • Graph 2 points on either side of the vertical asymptote. • Draw the branches.
Hyperbola (continued) • Second form: • Vertical asymptote: Set the denominator equal to 0 and solve for x. • Horizontal asymptote: • Graph 2 points on either side of the vertical asymptote. Draw the 2 branches.
6 Graph the function y = . Compare the graph with the graph of y = . x 1 x SOLUTION STEP1 Draw the asymptotes x = 0 andy = 0. STEP 2 Plot points to the left and to the right of the vertical asymptote, such as (–3, –2), (–2, –3), (2, 3), and (3, 2).
6 x 1 x The graph of y = lies farther from the axes than the graph of y = . STEP 3 Draw the branches of the hyperbola so that they pass through the plotted points and approach the asymptotes. Both graphs lie in the first and third quadrants and have the same asymptotes, domain, and range.
Ex: Graph State the domain & range. Vertical Asymptote: x=1 Horizontal Asymptote: y=2 x y -5 1.5 -2 1 2 5 4 3 Left of vert. asymp. Right of vert. asymp. Domain: all real #’s except 1. Range: all real #’s except 2.
Ex: GraphState domain & range. Vertical asymptote: 3x+3=0 (set denominator =0) 3x=-3 x= -1 Horizontal Asymptote: x y -3 .83 -2 1.33 0 -.67 2 0 Domain: All real #’s except -1. Range: All real #’s except 1/3.
• Write an equation that gives the average cost per model as a function of the number of models printed. 3-D Modeling A 3-D printer builds up layers of material to make three dimensional models. Each deposited layer bonds to the layer below it. A company decides to make small display models of engine components using a 3-D printer. The printer costs $24,000. The material for each model costs $300.
Unit cost • Number printed + Cost of printer c = Number printed 300m + 24,000 = m • Graph the function. Use the graph to estimate how many models must be printed for the average cost per model to fall to $700. • What happens to the average cost as more models are printed? SOLUTION STEP 1 Write a function. Let cbe the average cost and mbe the number of models printed.
Graph the function. The asymptotes are the lines m =0 and c = 300. The average cost falls to $700 per model after 60 models are printed. STEP 2 STEP 3 Interpret the graph. As more models are printed, the average cost per model approaches $300.
x – 1 4. y = x + 3 domain: all real numbers except –3, range: all real numbers except 2. ANSWER Graph the function. State the domain and range. SOLUTION
What is the general form of a rational function? • What does the h & k tell you? Asymptotes are x = h, y = k • What does the graph of a hyperbola look like? Two symmetrical branches in opposite quadrants. • What does the graph of ax+b/cx+d tell you? cx+d = 0 is the vertical asymptote and y = a/c is the horizontal asymptote • What information does the domain & range tell you? Domain tells what numbers can be used for x and the range is the y numbers when put into the equation.
Assignment p. 313, 6-8, 14-20, 28-31