Download
1 / 1
10 likes | 274 Vues
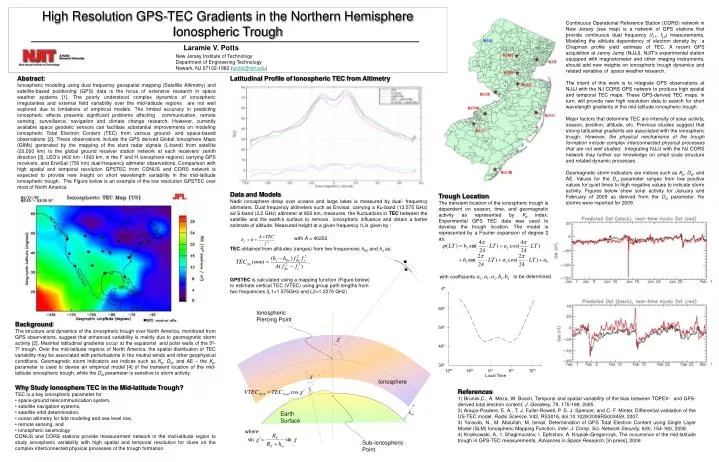
Ionospheric Piercing Point. 60º. 50º. 40º. Ionosphere. 30º. 12 hr. 18 hr. 0 hr. 6 hr. 12 hr. Earth Surface. h m. Local Time. Sub-ionospheric Point. High Resolution GPS-TEC Gradients in the Northern Hemisphere Ionospheric Trough.

E N D
Ionospheric Piercing Point 60º 50º 40º Ionosphere 30º 12hr 18hr 0hr 6hr 12hr Earth Surface hm Local Time Sub-ionospheric Point High Resolution GPS-TEC Gradients in the Northern Hemisphere Ionospheric Trough Continuous Operational Reference Station (CORS) network in New Jersey (see map) is a network of GPS stations that provide continuous dual frequency (fL1, fL2) measurements. Modeling the altitude dependency of electron density by a Chapman profile yield estimate of TEC. A recent GPS acquisition at Jenny Jump (NJJJ), NJIT’s experimental station equipped with magnetometer and other imaging instruments, should add new insights on ionospheric trough dynamics and related variables of space weather research. The intent of this work is to integrate GPS observations at NJJJ with the NJ CORS GPS network to produce high spatial and temporal TEC maps. These GPS-derived TEC maps, in turn, will provide new high resolution data to search for short wavelength gradients in the mid-latitude ionospheric trough. Major factors that determine TEC are intensity of solar activity, season, position, altitude, etc. Previous studies suggest that strong latitudinal gradients are associated with the ionospheric trough. However, the physical mechanisms of the trough formation include complex interconnected physical processes that are not well studied. Integrating NJJJ with the NJ CORS network may further our knowledge on small scale structure and related dynamic processes. Geomagnetic storm indicators are indices such as Kp, Dst, and AE. Values for the Dst parameter ranges from low positive values for quiet times to high negative values to indicate storm activity. Figures below show solar activity for January and February of 2009 as derived from the Dst parameter. No storms were reported for 2009. Laramie V. Potts New Jersey Institute of Technology Department of Engineering Technology Newark, NJ 07102-1982 (lpotts@njit.edu) Abstract: Ionospheric modeling using dual frequency geospatial mapping (Satellite Altimetry) and satellite-based positioning (GPS) data is the focus of extensive research in space weather systems [1]. The poorly understood complex dynamics of ionospheric irregularities and external field variability over the mid-latitude regions are not well explored due to limitations of empirical models. The limited accuracy in predicting ionospheric effects presents significant problems affecting communication, remote sensing, surveillance, navigation and climate change research. However, currently available space geodetic sensors can facilitate substantial improvements on modeling ionospheric Total Electron Content (TEC) from various ground- and space-based observations [2]. These observations include the GPS derived Global Ionosphere Maps (GIMs) generated by the mapping of the slant radar signals (L-band) from satellite (20,000 km) to the global ground receiver station network at each receivers’ zenith direction [3], LEO’s (400 km -1300 km, in the F and H ionosphere regions) carrying GPS receivers, and EnviSat (750 km) dual-frequency altimeter observations. Comparison with high spatial and temporal resolution GPSTEC from CONUS and CORS network is expected to provide new insight on short wavelength variability in the mid-latitude ionospheric trough. The Figure below is an example of the low resolution GPSTEC over most of North America Latitudinal Profile of Ionospheric TEC from Altimetry Data and Models Nadir ionosphere delay over oceans and large lakes is measured by dual- frequency altimeters. Dual frequency altimeters such as Envisat, carrying a Ku-band (13.575 GHz) ad S-band (3.2 GHz) altimeter at 800 km, measures the fluctuations in TEC between the satellite and the earth’s surface to remove ionospheric influence and obtain a better estimate of altitude. Measured height at a given frequency hf is given by : Trough Location The transient location of the ionospheric trough is dependent on season, time, and geomagnetic activity as represented by Kp index. Experimental GPS TEC data was used to develop the trough location. The model is represented by a Fourier expansion of degree 2 as; with A = 40250. TEC obtained from altitudes (ranges) from two frequencies hKu and hs as: to be determined with coefficients GPSTEC is calculated using a mapping function (Figure below) to estimate vertical TEC (VTEC) using group path lengths from two frequencies (L1=1.575GHz and L2=1.2276 GHz) • Background • The structure and dynamics of the ionospheric trough over North America, monitored from GPS observations, suggest that enhanced variability is mainly due to geomagnetic storm activity [2]. Maximal latitudinal gradients occur at the equatorial and polar walls of the 5º-7º trough. Over the mid-latitude regions of North America, the spatial distribution of TEC variability may be associated with perturbations in the neutral winds and other geophysical conditions. Geomagnetic storm indicators are indices such as Kp, Dst, and AE – the Kp, parameter is used to devise an empirical model [4] of the transient location of the mid-latitude ionospheric trough, while the Dst parameter is sensitive to storm activity. • Why Study Ionosphere TEC in the Mid-latitude Trough? • TEC is a key ionospheric parameter for • space-ground telecommunication system, • satellite navigation systems, • satellite orbit determination, • ocean altimetry for tide modeling and sea level rise, • remote sensing, and • ionospheric seismology • CONUS and CORS stations provide measurement network in the mid-latitude region to study ionospheric variability with high spatial and temporal resolution for clues on the complex interconnected physical processes of the trough formation. References 1) Brunini,C., A. Meza, W. Bosch, Temporal and spatial variability of the bias between TOPEX- and GPS-derived total electron content, J. Geodesy, 79, 175-188, 2005. 2) Araujo-Pradere, E. A., T. J. Fuller-Rowell, P. S. J. Spencer, and C. F. Minter, Differential validation of the US-TEC model, Radio Science, V42, RS3016, doi:10.1029/2006RS003459, 2007. 3) Ya’acob, N., M. Abdullah, M. Ismail, Determination of GPS Total Electron Content using Single Layer Model (SLM) Ionospheric Mapping Function, Inter. J. Comp. Sci. Network Security, 8(9), 154-160, 2008. 4) Krankowski, A., I. Shagimuratov, I. Ephishov, A. Krypiak-Gregorczyk, The occurrence of the mid-latitude trough in GPS-TEC measurements, Advances in Space Research, [in press], 2009. where