Download

1 / 30
300 likes | 305 Vues
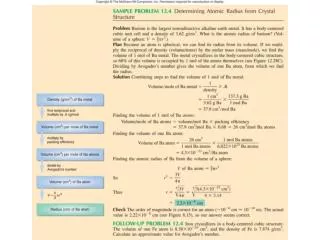
Prob and Stats, Sep 19. Grouped Data Computations and Percentiles Book Sections: 3.3-3.4 Essential Questions: How do I compute and use statistical values? What is grouped data, and how can I use it in statistical computations? What are percentiles and how are they used?

E N D
Prob and Stats, Sep 19 Grouped Data Computations and Percentiles Book Sections: 3.3-3.4 Essential Questions: How do I compute and use statistical values? What is grouped data, and how can I use it in statistical computations? What are percentiles and how are they used? Standards: PS.SP.ID.2, .3
Grouped Data • Grouped data – data that is summarized in a frequency table • Tabular only – no raw data is known • We use what we know – class width and frequency – to compute statistics • Mean • Standard deviation • These computations are approximate values
Grouped Data Class Width • We use the class midpoint as the value of the class in any grouped statistical computation. • The midpoint formula: where classlow and classhigh are the class boundries
Example Class (interval) Frequency (f) 5.5-10.5 1 10.5-15.5 2 15.5-20.5 3 20.5-25.5 5 25.5-30.5 4 30.5-35.5 3 35.5-40.5 2
Definition Class (interval) Frequency (f) 5.5-10.5 1 10.5-15.5 2 15.5-20.5 3 20.5-25.5 5 25.5-30.5 4 30.5-35.5 3 35.5-40.5 2 Definition: Modal Class – The class with the greatest frequency
Finding the Mean of a Group Where f is the class frequency, Xm is the midpoint, and n is the total frequency.
Making it Work Add two more columns to the table, as shown Class (interval) Frequency (f) 5.5-10.5 1 10.5-15.5 2 15.5-20.5 3 20.5-25.5 5 25.5-30.5 4 30.5-35.5 3 35.5-40.5 2
Making it Work Add two more columns to the table, as shown Class (interval) Frequency (f) MidPoint (Xm) f ·Xm 5.5-10.5 1 10.5-15.5 2 15.5-20.5 3 20.5-25.5 5 25.5-30.5 4 30.5-35.5 3 35.5-40.5 2
Finding the Standard Deviation of a Group We fight the this battle via variance, like last time Where f is the class frequency, Xm is the midpoint, and n is the total frequency and Xm2 is the square of the midpoint.
Making it Work Add three more columns to the table, as shown Class (interval) Frequency (f) 5.5-10.5 1 10.5-15.5 2 15.5-20.5 3 20.5-25.5 5 25.5-30.5 4 30.5-35.5 3 35.5-40.5 2
Making it Work Add two more columns to the table, as shown Class (interval) Frequency (f) MidPoint (Xm) f ·Xm f ·Xm2 5.5-10.5 1 10.5-15.5 2 15.5-20.5 3 20.5-25.5 5 25.5-30.5 4 30.5-35.5 3 35.5-40.5 2
Help Me Mr Texas! • Lucky you, the calculator can do it! Calculator needs – midpoints in L1 and frequencies in L2
Calculator Setup • You must use two lists to accomplish this calculator computation • Start with [STAT] select {EDIT} • Put class midpoints into L1: (lo + hi)/2 • Put frequencies into L2: one per midpoint • Press [STAT] select {CALC}, 1-Var stats L1,L2 • Only use mean and standard deviation
Example Compute the mean and standard deviation of this frequency table: Class (interval) Frequency (f) 2.1-2.7 12 2.8-3.4 13 3.5-4.1 7 4.2-4.8 5 4.9-5.5 2 5.6-6.2 1
Big Example Compute the mean and standard deviation of this frequency table: Class (interval) Frequency (f) 0-4 140 5-9 153 10-14 207 15-19 187 20-24 168 25-29 145
Partitioning Data • In the first half of this unit, we divided a data set into 4 equal parts by finding quartiles (Q values) • Now, we are going to conceptually do a similar set division into 100 equal parts called percentiles. • Reality says you need more than 100 pieces of data to accomplish this, but we will use theory to do it on less.
Percentiles • A percentile is a measure of position that a piece of data falls in if the set were divided into 100 equal parts. • This statistic would indicate how a value compares to the rest of the data as a percent in ascending order. • Percentiles are usually computed in very large data sets.
How are Percentiles Used? • Percentiles indicate how a single data value compares to all others, ranked as a percent. • Percentiles are frequently used in education and health-related fields to indicate how an individual compares to a group. Ex – SAT scores.
Interpreting Percentiles Percentiles indicate a rank relative to the data set, not some external measure. It is an internal comparison. If the weight of a six-month-old infant is at the 78 percentile, that child weighs more than 78% of all 6-month olds, not that the infant weighs 78% of some ideal weight.
Percentile Computations To compute the percentile of a particular data value, x, use the formula Percentile rank of x = Where B is the number of data values lower than the value of x, E is the number of terms equal to x, and N is the total number of values in the set.
Percentile Computations II %ile = You will have to think your way through this formula. Notice that the score itself (x) is not a part of this computation. Everything is relative to a position in the scores.
Percentile Computations III %ile = Breaking it down: if x is a value you want the percentile of • B is the number of items lower than x • Big problem: rank – 1, Small problem: Count those less • E is equal to, how many are equal to x? (1 is min) • N is the total. How many are there? • Truncate the answer (drop decimal values)
Example 1 The Big Problem Of 32,578 scores on the September SAT math test, Yanno was the 27,416th highest, and was tied with 77 others with his score. What is the percentile of Yanno’s score?
Example 2 The Small Problem In an English 4 class, the following were the grades on senior projects: 65, 68, 69, 71, 71, 73, 74, 75, 75, 77, 79, 79, 80, 81, 83, 83, 83, 84, 88, 88, 89, 93, 93, 95, 95, 96, 96, 98, 99 Jane made an 83. What is the percentile of her score?
Example 3 On the UN Quality of life survey, Anderson, SC was rated 13,218 highest for quality of life, and was tied with 48 other cities and towns, world-wide. There were 27,212 cities and towns evaluated in the report. What is the percentile of Anderson’s rank?
Your Example Tyrone practiced his skills in tiddlywinks two hours a day. Sure enough, he won his high school tiddlywinks contest, making 98 out of 100 attempts. The scores were as follows: 22, 29, 31, 35, 36, 40, 42, 45, 50, 55, 59, 61, 67, 73, 77, 80, 87, 88, 93, 97, 98 What was the percentile of Tyrone’s score score? B = E = N =
Percentile Computations Backwards %ile = If given a percentile and asked for B, E, or N, convert the % to a decimal (p) and think of the formula like this:
Class work: Classwork 9/19/16, 1-10 Homework: HW Due 9/20/16, 1