Download
1 / 9
90 likes | 246 Vues
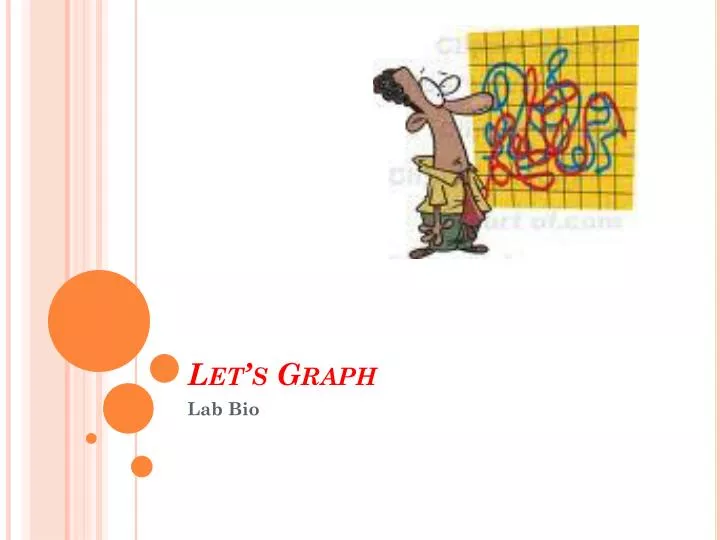
Let’s Graph. Lab Bio. Why Graph?. BRAINSTORM Spend 5 minutes writing down why graphing can be useful… What can we learn anything from the following graph?. Some Important Terms To Know…. All graphs must include 5 major parts Title: Be specific Independent Variable: What WE can control

E N D
Let’s Graph Lab Bio
Why Graph? • BRAINSTORM • Spend 5 minutes writing down why graphing can be useful… • What can we learn anything from the following graph?
Some Important Terms To Know… • All graphs must include 5 major parts • Title: Be specific • Independent Variable: What WE can control • The Dependent Variable: The change or outcome based on the independent variable • The Scales for each variable: All data points must be used & YOU NEED TO USE THE WHOLE PAPER!!! • The Legend: A short paragraph…kind of like the Cornell Notes Summary
Independent & Dependent Variables • Independent variable is the one WE can control. • Examples: Time, distance, length, temperature, etc • Always goes on the X axis (bottom) • Dependent variable DEPENDS on what happens when we change the independent variable • Always goes on the Y axis (side) • Example: WE control the depth, but the number of bubbles change. • Did we control the number of bubbles?
Let’s Look… Number of Bubbles Depth in Meters I made some errors on purpose. Can you see them? How can we improve this graph?