Download
1 / 33
330 likes | 501 Vues
INTRODUCING THE CHESAPEAKE BAY TMDL PROCESS TO VIRGINIA. November 2009. Chesapeake Bay Ecosystem. Largest U.S. estuary Six-state, 64,000 square mile watershed 10,000 miles of shoreline (longer then entire U.S. west coast) Over 3,600 species of plants, fish and other animals

E N D
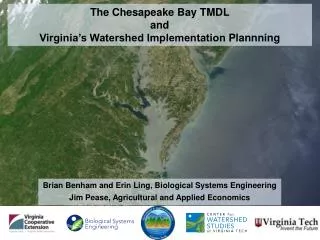
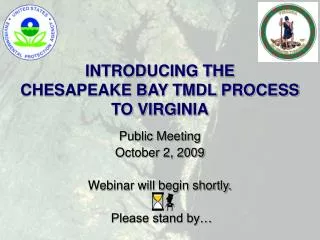
INTRODUCING THECHESAPEAKE BAY TMDL PROCESSTO VIRGINIA November 2009
Chesapeake Bay Ecosystem • Largest U.S. estuary • Six-state, 64,000 square mile watershed • 10,000 miles of shoreline (longer then entire U.S. west coast) • Over 3,600 species of plants, fish and other animals • Average depth: 21 feet • $750 million contribution annually to local economies • Home to 17 million people (and counting) • 77,000 principally family farms • Declared “national treasure” by President Obama Source: www.chesapeakebay.net
Main Sources of Pollution • Agriculture – animal manure, commercial fertilizer • Urban/suburban runoff – a growing problem • Air pollution – tailpipes, power plants • Wastewater – sewage treatment plants
New Approach to RestorationPerformance and Accountability • Total Maximum Daily Load (TMDL): Mandatory ‘pollution diet’ • Chesapeake Bay Executive Order: New era of federal leadership • Two-Year Milestones: State/local commitments to action • Consequences: Federal monitoring; consequences for lagging progress
Chesapeake Bay TMDL • EPA sets pollution diet and oversees its achievement • Restrictions on nitrogen, phosphorus and sediment • Limits sufficient to meet states’ Bay clean water standards
Taking Responsibility for Load Reductions Identify basinwide target loads EPA, States, DC Identify major basin by jurisdiction target loads EPA, States, DC Identify tidal segment watershed, county and source sector target loads States, DC, local governments & local partners
Pollution Diet for Each Impaired Tidal Water Segment • Clean Water Act requires a TMDL for each impaired waterbody • MD, VA, DE, DC have listed most of the Bay’s 92 tidal water segments as impaired • All 6 watershed states must be part of reaching the prescribed diet for each of these Bay tidal water segments
Counties Overlaying the Watersheds Draining to Virginia’s 35 Tidal Bay Segments
Restoring Virginia’s Rivers/Bay • Virginia is down-stream/down-tide of others • Must do its share of reductions, but can’t restore tidal rivers and Bay water quality alone! • James, York Rivers must also address local water quality problems • Tidal York River has oxygen and bay grasses problems • Tidal James River has algae and bay grasses problems • Bringing Bay restoration to where local decisions are made that impact water quality • Counties, cities, towns, conservation districts • Opportunity to build on VA Clean-up Plan • Factor in local TMDLs, local water quality needs
EPA Consequences Will be outlined in EPA letter this fall. May include: Assigning more stringent pollution reductions to point sources Objecting to state-issued NPDES permits Limiting or prohibiting new or expanded discharges of nutrients and sediment Withholding, conditioning or reallocating federal grant funds
Decision Made…. • PSC approved preliminary basinwide target load of 200 million pounds per year nitrogen and 15 million pounds per year phosphorus
These Basinwide Target Loads Will Change Due to… • Upgraded watershed model (Phase 5.2 to 5.3) • Filter feeder inclusion in the WQ model • SAV/clarity target load analysis • Atmospheric deposition allocation and impact on ocean load • Trade-offs between N and P • Loading reductions needed to meet local Bay segments
Relative Effectiveness is a combination of Watershed Delivery and Estuarine Delivery Low Delivery || \/ High Delivery Potomac Estuarine Effectiveness James Estuarine Effectiveness
Review of Target Load Method from April 2 2 2 2 2
0.22 mg/l 0.53 mg/l Option B 20 percent slope
State Total Target LoadsOPTION B SELECTED BY PSC Nitrogen Phosphorus All loads are in millions of pounds per year.
VA Basin Target Loads*[Million Pounds/Year] -----Total Phosphorus --------- --------Total Nitrogen-------- *These target loads are likely to change based on EPA’s new modeling; allocation loads for the basins are expected to be set in spring of 2010; EPA’s current plan is to adopt Bay TMDL by 12/31/10.
Watershed Implementation Plan Expectations • Identify reductions by river basin, tidal segment watershed, county, source sector • Identify gaps and strategy for building local capacity • Commit to develop 2-year milestones at the county scale • Develop contingencies
Watershed Implementation PlansApproved along with TMDL • States must develop Plans to demonstrate to EPA “reasonable assurance” that allocations assigned to each source sector will be met • Allocations will need to be assigned to these source sectors within each basin:
EPA’s Response to Concerns with Short Timeframe to Develop Plans • Defer some planning elements to a later date • Phase I Plan: Target loads by source sector and segment drainage area to inform Bay TMDL WLAs and LAs • Preliminary: June 1, 2010 • Draft: August 1, 2010 • Final: November 1, 2010 • Phase II Plan: Include local area target loads and identify specific controls to be implemented by 2017 • Draft: June 1, 2011 • Final: No later than November 1, 2011 • 2-year Milestones: Near-term, specific commitments and actions • Iterative: 2012 – 2013; 2014 – 2015; etc. • Phase III Plan: Update 2018 - 2025 implementation efforts • Final: No later than January 1, 2017
Staged Implementation • Stage 1: Current Loads – Interim Target • 2011 – 2017 • Stage 2: Interim – Final Target • 2018 – no later than 2025 • Less details on Stage 2 if States and District commit to update Plans by 2017 • Potential actions that will result in final target loads to provide assurance that final TMDL will be achieved • Recognize 2018 – 2025 milestones may change • Specific implementation efforts adapted and assessed through 2-year milestones
Interim Target Load • States and District must have controls in place to meet interim target by 2017 • Demonstrates on track to meet final target load by 2025 • EPA assesses if 2-year milestones on schedule to meet interim and final target loads and imposes consequences as necessary • 60% between 2008 loads and target loads • Basinwide: 233 mil lbs/yr N and 15.5 mil lbs/yr P • Represents ~18% decrease of N and ~5% decrease of P compared to 2008 loads • Corresponds to modeled water quality improvements • With greater justification, EPA may accept interim target of no less than 50% between current and target loads
Basinwide Interim Target Load EPA Will Assess if Milestone Reductions are on Schedule to Meet Target Loads 284 <Interim Target 233 200 Assumes Upfront Program-Building and Future Reductions Assumes Constant Reduction Over Time Assumes Upfront Low-Hanging Fruit and More Difficult Future Reductions
Example: Projected Nitrogen Delivery from Major Basin in Each Jurisdiction by Source Sector Propose new legislative authorities Implement regulatory controls Examples of Some Planned Controls Propose increased budget to legislature Increased program budget Increased controls Rulemaking 35 26 Load Reduction Schedule 20 Interim Targets Final Targets Milestones for Assessing Progress Stage 1 Implementation Stage 2 Implementation • Also divide jurisdiction load by 303(d) segment drainage area and, by November 2011, local area • Attain jurisdiction-wide load reductions by the interim target, or justify why can still meet final target • Jurisdiction would determine desired 2-year schedule to meet interim and final target loads • EPA first evaluates milestones based on consistency with jurisdiction target load. EPA accepts shifts among source sectors, basins, segment drainages, and local areas if jurisdiction target load is met and local and Bay water quality goals are achieved
VA Public Meeting Schedule • December 14 – 6:30 pm – 8:30 pm Fairfax County • Falls Church High School, Little Theater, 7521 Jaguar Trail, Fall Church, • December 15 - 6:30 pm – 8:30 pm James City County • 2007 Legacy Hall 4301 New Town Avenue Williamsburg • December 16 - 6:30 pm – 8:30 pm Harrisonburg Area • Spotswood High School 368 Blazer Drive Penn Laird • December 17 - 6:30 pm – 8:30 pm Fredericksburg • Wingate Inn 20 Sandford Drive, Fredericksburg
Proposed Stakeholder Processin Virginia *2-Pronged Approach* • Smaller “scoping group” produce a strawman of options – [for DCR source categories] • Larger, more active, Stakeholder Group involved throughout the process
Impacts on DEQ Programs • DEQ will begin allocation process with allocations for wastewater plants identified in VA-WQMP reg • EPA will approve allocations among source sectors based on reasonable assurance, so allocations in final TMDL are unknown • Also, uncertain about expectations for CAFOs and Industrial Storm Water