Download
1 / 16
160 likes | 356 Vues
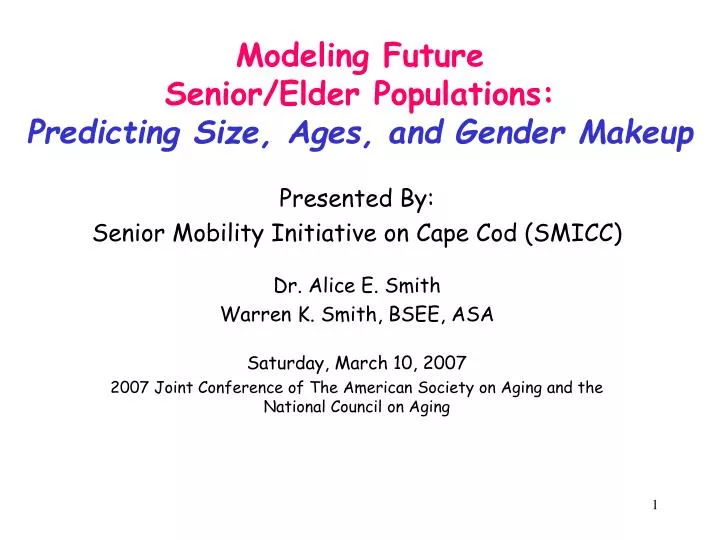
Modeling Future Senior/Elder Populations: Predicting Size, Ages, and Gender Makeup. Presented By: Senior Mobility Initiative on Cape Cod (SMICC) Dr. Alice E. Smith Warren K. Smith, BSEE, ASA Saturday, March 10, 2007

E N D
Modeling Future Senior/Elder Populations: Predicting Size, Ages, and Gender Makeup Presented By: Senior Mobility Initiative on Cape Cod (SMICC) Dr. Alice E. Smith Warren K. Smith, BSEE, ASA Saturday, March 10, 2007 2007 Joint Conference of The American Society on Aging and the National Council on Aging
Senior/Elder Population Modeling An analytical tool that assists researchers to predict the future number, ages, and gender of senior/elder populations (state, region, county, city, town, or ZIP Code area). Developed to assist senior/elder mobility services planners, such estimates are invaluable to anyone needing estimates of age 55+ populations for up to 30 years into the future.
Why Do Predictions Ourselves? • Why not use State Data Center predictions? • County- and Town –level only available • Crude knowledge of in/out migration • Cape Cod’s justification: • ZIP Code-level population counts needed • “Retirement migration” needs to be included • Need “What If’ modeling capability
In Migration Births Starting Population (1980 Census) Ending Population (1990 Census) “Cohort-Component Method” Deaths Out Migration Simple Population Model (Developed by U.S. Census Bureau)
Model Components Starting Population: U.S. Census Counts by 5-Year Age Group Births: Birth Certificate data Deaths: Death Certificate data Migration: In ?? Out ?? Ending Population: U.S. Census Counts By 5-Year Age Group
Dilemma Problem: We Don’t Have Accurate Migration Data! Solution: We Have To Calculate It
Concept of “Net Migration” To Model a Population, Knowing The Net Number of In-Migrants and Out-Migrants by Age Group is Sufficient This Fact Simplifies Our Calculation
Births (Can Ignore For Senior/Elder Age Ranges) Cohort-Component Method Starting Population (1980 Census) Ending Population (1990 Census) Deaths Net Migration Calculating Senior/Elder Net Migration
Solving For Net Migration of Seniors/Elders Net Migration: Ignoring Births, Net Migration is Simply The Difference Between Starting Population Minus All Deaths and The Ending Population Count; Where: PEnd = PStart - D + MNet Therefore: MNet = PStart - D - PEnd
1980 Census 1990 Census Census 2000 Cohort-Component Method Cohort-Component Method Studied Past Population Dynamics Historic Senior/Elder Population Dynamics: 1980-2000 (“Boomers” in their 30’s and 40’s) (“Boomers” in their 40’s and 50’s) Determined Growth History For EACH Age Group: Ages 40-44, 45-49, 55-59, 60-64, 65-69, 70-74, 75-79, 80-84, 85+ Calculated 20-Year AVERAGE Migration Factor For Each Age Group
Predicting Future Populations Starting Population Counts(by Age Group) Historic 20-Year AVERAGE Migration Rates (By Age Group) Microsoft EXCEL Spreadsheet Model Ending Population Counts(By Age Group) “What If” Factors Death Rates (by Age Group)
Result: Population Predictions(Numbers of Persons by Age Group)
Q & A ** Discussion **
Dr. Alice E. Smith President, Family-Centered Institute, Inc. 66 Massasoit Trail Brewster, MA 02631 alismith@clarku.edu Warren K. Smith Chairperson, Senior Mobility Initiative on Cape Cod c/o Family-Centered Institute, Inc. 66 Massasoit Trail Brewster, MA 02631 wsmithstat@aol.com Contact Information
Introductory Remarks: Good Morning. My name is Dr. Alice Smith and I am here with my colleague (and husband), Warren to tell you about a method that we have been using up on Cape Cod in Massachusetts to predict what our future senior/elder population will look like—10-, 15-, 20-, even 30-years into the future. Briefly, we put historic Census statistics and other key demographic data into a computer spreadsheet (Microsoft EXCEL) and developed formulas that MODEL how our senior/elder population has changed in the past—the dynamics of it. From this retrospective MODEL, and some thoughtful assumptions about future changes, we have been able to predict the basic charac- teristics of our FUTURE senior/elder population—from 2010 out to the year 2035. How do we use these predictions? Planners on Cape Cod are beginning to use this information as they develop long-range plans for a variety of programs and services for our rapidly growing “Baby Boomer” population—or should I say, “Senior Boomers”? Our local Area Agency on Aging (Elder Services of Cape Cod & Islands) and several of our municipal Councils on Aging are using these population predictions in their strategic planning. Also, we have had great interest from our regional emergency planning organizations, as well as Fire Chiefs and municipal EMS/EMT service planners. One of our larger towns (Falmouth) is using our population predictions to justify building a new multi-million dollar Senior Center. In addition, Grant writers are beginning to use this information as they develop county, state, and federal funding proposals. In our own research, we use these population predictions as the basis of what we call our Senior MoAbility Indicators (presented in our Workshop yesterday morning). These Indicators are a set of twenty mobility characteristics that serve to generally describe the ability of seniors and elders to “get up, get out, and get about” in their community—again, a tool for planning future senior/- elder programs and services. Now, my husband Warren is going to tell you briefly about how the future population prediction MODEL was developed, how it works and show you a few examples of how it is being utilized. Warren . . . .