Download
1 / 35
420 likes | 1.58k Vues
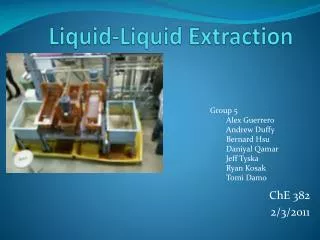
Liquid-Liquid Extraction. Experiment 350 ECH4404L: Unit Operations Lab II Instructor : Dr. Loren B. Schreiber Senior Lab Engineer : Mr. Richard Crisler Teaching Assistant : Mike Kirkpatrick. Team 8. Team Leader : Calvin Alleyne Safety Officer : Tehra Bouldin Team Members :

E N D
Liquid-Liquid Extraction Experiment 350 ECH4404L: Unit Operations Lab II Instructor: Dr. Loren B. Schreiber Senior Lab Engineer: Mr. Richard Crisler Teaching Assistant: Mike Kirkpatrick
Team 8 Team Leader: Calvin Alleyne Safety Officer: Tehra Bouldin Team Members: Adeola Ayanwale Ken Decoteau Candi Fails
Outline • Introduction • Theory • Safety • Operation and Data Acquisition Details • Conclusions • Acknowledgments
Extraction • Introduction to Experiment 350 : Liquid-Liquid Extraction • Physical Situation • Objectives • Plan of investigation
Physical Situation • Experiment 350 involves the removal of ethanol from a 40% ethanol / 60% n-heptane mixture (percentages based on mass). • The organic mixture is fed counter-current to the extraction solvent, water, to a 6 foot high, 1 inch diameter Karr extraction column. • The vertical column houses reciprocating plates that agitate the n-heptane, allowing for more ethanol extraction.
Main Objectives Determine: • solvent flow rate for 99.5% removal of ethanol from the feed • speed of reciprocating plates to remove 99.5% of the ethanol from the feed using 65% and 35 % of the initial solvent flow rate • theoretical number of stages necessary for the separation • the reproducibility of the measurements
Learning Objectives: • Gain experience working with an extraction column. • Learn to use a Gas Chromatagraph in a real world application.
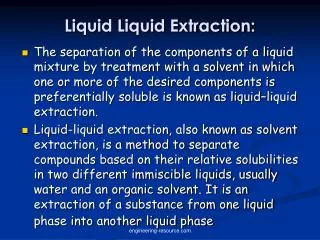
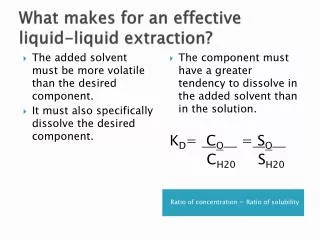
Theory The countercurrent extraction of ethanol from heptane to water occurs mostly because of the solubility differences of ethanol in these two solvents. Ethanol is more miscible in water than in heptane.
Reciprocator Plates The reciprocator plates housed in the Karr extractor column have an impact on the extent of extraction as well. Physically the plates disperse the ethanol-heptane bubbles as they rise through the water. The reduction in the volume of the individual bubbles allows for more surface area of the bubbles to be in contact with the solvent.
Surface Area Due to the increase of surface area more mass transfer can occur, as the ethanol leaves a non-aqueous phase liquid (heptane) and dissolves into the water.
Ternary Data Ternary system data provided by Dr. Schreiber in the laboratory was highly helpful, allowing for a plot of the equilibrium curve. Also, "tie-line" data was provided for the components of the ternary system.
Tie Lines Using a procedure outlined in Transport Process and Unit Operations (Geankopolis) an equilibrium plot was created with Microsoft Excel using the "tie line" data. The "D point" was then extrapolated from the "tie line" data. From this plot, the theoretical number of equilibrium stages of the extractor column was calculated.
Mass Balance Let L0 = initial mass flow rate of feed; xethanol = mass fraction of ethanol in feed; xheptane = mass fraction of heptane in feed; Vn = the mass flow rate of the solvent (water) entering the column Vn+1 = the mass flow rate of the raffinate; yheptane = mass fraction of heptane in raffinate; yethanol = mass fraction of ethanol in raffinate
Mass Balance (cont.) Let Ln = the mass flow rate of the extract leaving the column; x'ethanol = mass fraction of ethanol in the extract; x'heptane = mass fraction of heptane in extract; x'water = mass fraction of water in the extract §Special note: 1- x'ethanol - x'heptane = x'water
Mass Balance (cont.) L0 + Vn = Vn+1 + Ln Species Balance on Ethanol: xethanol L0 = yethanol Vn+1 + x'ethanol Ln Species Balance on Heptane: xheptane L0 = yheptane Vn+1 + x'heptane Ln Mass % Conversion of Ethanol: 100% + ((yethanol Vn+1 + x'ethanol Ln) - (xethanol L0) / (xethanol L0)) = mass % conversion of ethanol
Safety • Proper Personal Protective Equipment must be worn at all times during this experiment. This includes: • Goggles (NO CONTACTS) • Close-toed leather shoes, Jeans • No loose clothing • Gloves when dealing with any chemicals • Hard Hats in the designated area
Safety • n-Heptane and Ethanol-Signs of acute exposure: • Skin-irritation, redness, and pain • Eyes-Irritation, redness, and pain • Inhalation-Irritation of respiratory track. Aspiration into lungs can cause severe lung damage • Ingestion-Nausea and abdominal pain
Safety • First-Aid Measures: • Skin- Flush the skin with water and soap for at least 15 minutes. Remove contaminated cloths and wash before wearing again. • Eyes- Flush the eyes with water for at least 15 minutes. Get medical attention. • Ingestion- Aspiration hazard. Get medical attention and seek medical attention immediately.
Operations and Data Acquisition • Calibrating the Pumps • Calibrating the GC • Startup • Data Acquisition • Shutdown • Cleanup
Pump Calibration • Close the valve that runs into the column and open solvent valve to allow the liquid to flow into a jar placed on the mass balance. • Set the flow rate on the rotameter and turn on the pump to start the liquid flowing. Time for 1 minute after flow stabilizes Record the mass at the initial and the final times. • Repeat the measurement at the set flow rate at least twice for all settings.
Gas Chromatagraph • Standard Preparation • Sample Injection • Data Analysis
Standard Preparation • Prepared Samples: • 0.2, 0.4, 0.6, 0.8, 1.0% Ethanol • At least 2 GC's performed on each standard • Analyzed the data based on the average area percent of the ethanol peak given by the GC • A linear regression of the data gives: (Area %) = (% Ethanol)*0.723 -0.0721
GC Sample Injection • Shake the sample for 30 seconds in the bottle . • Take the cap off. • Wipe the microsyringe needle clean. • Flush the syringe 3 times with sample, ejecting into the chemwipe. • Draw 10 microliters into syringe. Invert and push out some fluid while tapping. Set mark at 1 microliter. Wipe. • Aim, push in, inject, press run and withdraw. • Cap sample.
Data Acquisition • Raffinate Samples: • Methods of taking samples • Sample Analysis using the GC • Extract Samples: • Methods of taking the samples • Sample Analysis using the Pcynometer
Raffinate Sampling Method: • Unscrew top of raffinate collection container. • Wash the sample bottle three times with the raffinate. Fill to top and cap. • Label with sample #. • Shake bottle for 30 seconds. • Run 2 GC's
Raffinate Data Analysis • Average the area percent response given by the GC for each sample. • Use the calibration curve from the standards to determine the percent of ethanol in the sample.
Extract • Sampling Method • Fill the pycnometer with the extract and weigh • Measure the temperature of the solution • Clean out and dry the pycnometer and repeat
Extract: Data Analysis • Determine the density of solution using the recorded mass and the known pcynometer volume. • Using published data relating the percentage of ethanol in water to solution density, perform a quadratic regression. • Using the regression, determine the percentage of ethanol in the extract based on the recorded density.
Clean up • Safely shutting down the extraction column • Disposal of waste: • Feed, extract and raffinate • Samples taken from the Raffinate • Samples taken from the Extract • Visual inspection
Conclusions • The removal of ethanol from the feed occurred at a minimum of 99.2% via mass from our experimental data (with 35% of the solvent flow rate) and a high reciprocator plate speed (approx. 100 cycles / minute) • Our solvent flow rate at 35% was too small for proper removal of 99.5% of ethanol via mass (we picked too low of a feed flow rate, which implies the 35% solvent flow rate) even though plate speeds were in excess of 100 cycles / minute • The plate speed of about 50 cycles / minute kept our removal at approximately 99.5% while at 65% of the solvent H2O flow rate (via mass)
Conclusions • At approximately 0.6 g/s of water (solvent flow rate into the system) we achieved 99.5% removal • Although the theoretical data provided was "slightly skewed" (at a lower temperature 25°C) than the experimental data (approximately 33°C), • the equilibrium data provided by Dr. Schreiber was consistent with the experimental data, specifically the equilibrium curve calculating the equilibrium number of stages (drawn out from a procedure outlined in Geankopolis)
Thanks go to: • Dr. Pedro Arce • For taking time out of his busy schedule to listen to us. • Dr. Loren B. Schreiber • For providing us the opportunity to learn. • Mr. Richard Crisler • For keeping the GC running. • Mike Kirkpatrick • For keeping us straight.