Download
1 / 35
370 likes | 486 Vues
Brief history of the battery. Battery University online:. First battery. -0.76V vs SHE. 0.34V vs SHE. Total voltage: 1.1 V. Energy Storage: Lithium ion battery. e -. e -. Discharged state. Discharging. Charged state. Cathode. Anode. C (graphite anode) Co 3 O 4 (cobalt oxide anode).

E N D
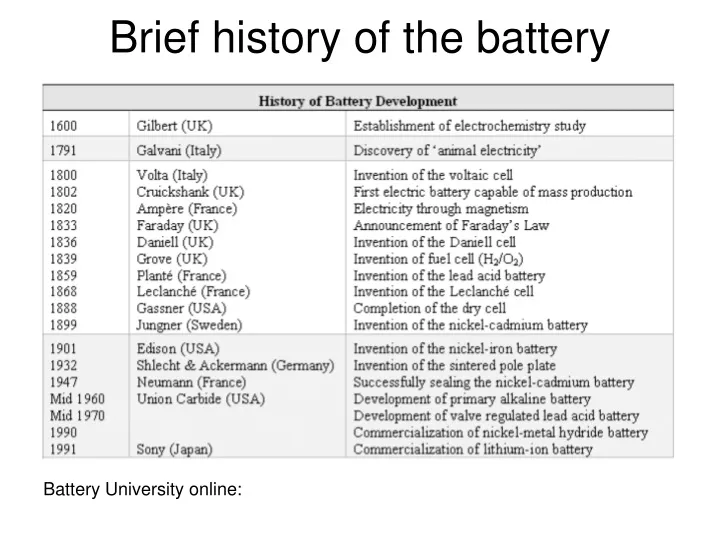
Brief history of the battery Battery University online:
First battery -0.76V vs SHE 0.34V vs SHE Total voltage: 1.1 V
Energy Storage: Lithium ion battery e- e- Discharged state Discharging Charged state Cathode Anode C (graphite anode) Co3O4 (cobalt oxide anode) LiC6 (graphite anode) Li2O/Coo (cobalt oxide anode) FePO4 cathode CoO2 cathode LiFePO4 cathode LiCoO2 cathode = Li+ = LiPF6
Common to all Li ion batteries • Conducting current collectors • Anode • Cathode • Electrolyte • Seperator Tarascon, J.M. & Armand, M., Nature,414, (2001)
Lightweight, typically metallic Chemically resistant Stable at cell voltages Courtesy: Lt. Col. F. John Burpo Conducting current collectors Stainless steel anode current collector
Seperators: permeability and stability • Must be an electronic insulator • Must be ionic conductor • Chemically resistant • Stable in electrolyte Read: Arora, P., and Ahengming, Z., Chemical Reviews,2004, 4419-4462
The electrolyte must be a good ionic conductor, and an electronic insulator Must be stable at necessary potentials and temperatures Performs minimal side reactions with electrodes Much of battery failure and degradation is caused by electrolyte side reactions Electrolyte Xu, K., Chemical Reviews,2004 4303-4417
Safety concerns with current Li ion batteries drive to higher potential anodes • Safety improvements • Electrolyte stabilization • Li dendrite formation…
Lithium plating and dendrites Tarascon, J.M. & Armand, M., Nature,414, (2001) Xu, K., Chemical Reviews,2004 4303-4417
Cathode SEI and internal resistance • Cathodes can be fouled by degradation of electrolyte on the surface of the material • For instance Ethyl carbonate can form polymeric olefins on the surface of the electrode • Typically the SEI is a poor ion conductor and will increase the internal resistance of the battery
Internal resistance • The internal resistance increases in the battery over time • The actual voltage output is never exactly the same when current is being drawn from the battery as when there is no current being drawn • The higher the internal resistance is, the lower the observed voltage will be when
Measured by intentionally shorting the battery using a defined resistor Once the internal resistance is known, the maximum cell output can be calculated Internal resistance is a function of SEI, electrode conductivity, and surface area Internal resistance measurement DV=1.22 V
Chemical energy storage • Cell potential is determined by the difference in Gibbs free energy of the Lithium in the anode and cathode • The electrodes must allow ions to flow through them • This is helped by using layered structures • Making nanoscale materials • Coating or percolating the system with conducting material • How do we measure battery materials? • Specific Capacity • Energy • Power • Ragone plot • Galvanostatic measurement
Chemistries of electrodes • Most common electrode system is that of LiCoO2 and graphite 0.1 V vs. Li 3.8-3.9 V vs. Li 3.7 V total
Characterization • The cell voltage is the average voltage of the discharge cycle • LiCoO2 has an average discharge voltage of 3.7 V From Nokia
Other Cathode Materials LiFePO4 Li2MnSiO4 1. Ohzuku, T.; Brodd, R. J., J.Power Sources 2007, 174, (2), 449-456; 2. Amatucci, G. G.; Pereira, N., J. Fluorine Chemistry 2007, 128, (4), 243-262; 3. Howard, W. F.; Spotnitz, R. M., J. Power Sources 2007, 165, (2), 887-891.
Capacity calculation on a typical anode Capacity calculated for cobalt oxide to be 881 mAh/g
Volume changes in battery electrodes • Metallic anodes behave entirely different from typical oxide anodes • Typically a metal will form an alloy with lithium by formally reducing the lithium • Failures in metallic anodes are usually due to volume changes • Volume changes literally cause for the electrode to be destroyed • Most alloying electrodes are not stable for more than a couple charge/discharge cycles Tirado, J.L., Materials Science and Engineering R 40, 2003, 103-136
Gold or metallic anodes • Au anode can alloy with lithium (this is not the same as graphite being plated with lithium • Phases of gold/lithium alloys • Ag and Au can have several alloy phases (AgLi9 or Au4Li15) • There are many systems that can form alloys with lithium (tin or silicon) but the volumetric expansion is so great that the electrode is unstable • These electrodes are special in that they actually catalyze the reduction of Li+ to Lio • This catalysis has various potentials vs. Li metal, typically around 0.7 V
Alloy forming anodes for Lithium ion batteries • Au or Ag : capable of alloying with Li up to AgLi9 and Au4Li15 at very negative potential • Advantages in minimizing cell voltage reduction • High theoretical capacity http://www.asminternational.org/ Taillades, 2002, Sold State Ionics
Pure Au viral nanowires Diameter: ~40 nm, free surface • Plateaus: • 0.2 and 0.1 V/discharge • 0.2 and 0.45V/charge • Capacity from 2nd cycle • 501 mAh/g [AuLi3.69]
Discharge/charge curves from the first two cycles Au0.9Ag0.1 Au0.5Ag0.5 Au0.67Ag0.33 Gradual changes in potential during discharge Capacity at 2nd cycle : 499 for Au0.5Ag0.5 459 for Au0.67Ag0.33 Au0.9Ag0.1 Curve shape similar with Au Capacity at 2nd cycle : 439
Calculating capacity for Gold Anode Capacity is measured in mAh/g and is a measure of the amount of current you can get out of your electrode with respect to mass This will yield an overall capacity of 445.9 mAh/g
Calculating capacity for Gold Anode Use the theoretical capacity to determine the charge rate First find the active mass, not everything in the electrode is active Example: a 2 mg electrode with 20% inactive material (super P and PTFE binder) In order to discharge this electrode over one hour, apply a -0.499 mA current
Used Mortar and Pestle to prepare electrodes Added binder to roll out electrode Assemble into coin cell Courtesy: Lt. Col. F. John Burpo Coin cell assembly Stainless steel anode current collector
Testing battery on Solartron 16 channels for testing batteries 8 coin cell testers Celltest program for measurement and analysis
Preparing test schedule Battery measurements are done on the Solartron using the program Celltest: In order to test the battery, place in coin cell holder: Celltest works in a simple order, first make a test schedule, then an experiment, then run. Each test schedule will consist of: Initial rest that lasts one minute (this is just to make sure that the coin cell is being tested correctly) A discharge step A charge step
Preparing test schedule Do a 1C charge and discharge Change to current control Constant for 60 hours Type in calculated charge/discharge current (negative for discharge)
Preparing test schedule Measure on change On “termination” tab jump to next step based on voltage: 0.1V for discharge, 2.5V for charge
Preparing a Celltest experiment Save data file as your group name Select your test schedule to run on the correct channel You must set safety limits of 5 V and 4 A, in case something got connected incorrectly
Calculating actual capacity for Gold Anode After running the electrode the data that will be available will be: the negative applied current, the time of the measurement and the mass of active material Use the current (in milliAmps), time (in hours) and the mass (in grams) to determine the actual capacity for your anode
The Ragone chart Necessary for comparing different energy types For comparison Gasoline has an energy density of 12 kWh/kg and nuclear fission can yield 25 billion Wh/kg The chart plots the total amount of energy stored vs how quickly the energy if made available
Rate Capability of a-FePO4 nanowire/SWCNTs conjugate templated on different phages. Ragone plot showing improvement in high power performance with higher binding affinity towards SWCNTs Well-dispersed SWCNTs even with smaller amount alone make better electric wiring to active materials due to better percolation networks than super p carbon powders. Tested 2 V and 4.3 V Y. J. Lee et al., Science 324, 1051 (May, 2009).
Amount of material to provide electricity for one hour, one day, one week and one month with no external energy production • Daily short term: • For short term daily energy storage, ~50 kg of Li-ion batteries, will provide all electrical needs of the average household • Long term: • Insolation never drops below 50% of the average throughout the year (even on the cloudiest day!), so with >50% energy production by solar, two 2000 gallon tanks will provide all electricity required for the three months of winter if they can be adequately charged during the summer months
Helpful websites • http://www.sandia.gov/ess/About/projects.html • http://www.eia.doe.gov/fuelelectric.html (Nearly all information on energy production and consumption in the US) • http://rredc.nrel.gov/solar/old_data/nsrdb/redbook/atlas/ (information on solar energy) • http://www.electricitystorage.org