Download
1 / 35
350 likes | 550 Vues
from David Keith. from David Keith. Actual emissions exceed the worst case scenario CO 2 is rising even faster than expected. 10. A1FI. 9. B1. Actual Emissions, EIA. 8. Anthropogenic Emissions Gigatons carbon (as CO 2 ). Stabilization at 450 ppm. 7. 6. 5.

E N D
Actual emissions exceed the worst case scenario CO2 is rising even faster than expected 10 A1FI 9 B1 Actual Emissions, EIA 8 Anthropogenic Emissions Gigatons carbon (as CO2) Stabilization at 450 ppm 7 6 5 1990 1995 2000 2005 2010 Raupach et al. 2007, Canadell et al. 2007, PNAS
Seven “wedges” 7 GtC/y Flatpath projected path “The solution that will work comes not as a single bolt from the blue, but from a combination of multiple, varied efforts.” Jamais Cascio 14 14 GtC/y Stabilization triangle Carbon Emissions, billions of tons per year Historical emissions 7 0 1955 2005 2055 R. Socolow, http://www.princeton.edu/~cmi/
Wedges for the US • Natural Resources Defense Council scenario 3.0 Electricity end-use efficiency 2.0 Other end-use efficiency Passenger vehicle efficiency Carbon emissions, billions of tons per year Other transport efficiency Renewables 1.0 Carbon capture and storage 0 2000 2010 2020 2030 2040 2050 Socolow and Pacala 2006
AZ Wedges by sector 180 Agriculture and Forestry Projected Emissions 160 Transportation & Land Use 140 Energy Supply 120 Historical Emissions Residential, Commercial & Industrial 100 Million Metric tons of CO2 80 60 40 20 0 1990 2000 2010 2020 Reports from the Governor’s Climate Change Advisory Group at www.azclimatechange.us
Projected Emissions Arizona Kyoto Neutral by 2020 2010 2015 2020 Northern Arizona University 100000 Historical Emissions 90000 80000 70000 60000 Electricity Metric tons of CO2 Transportation 50000 Natural Gas 40000 Solid Waste 30000 20000 10000 0 1990 1995 2000 2005 Climate Change Mitigation Class, Spring 2006
My house 8000 7000 6000 5000 kg CO2 per year 4000 Paul’s house 3000 George’s house 2000 1000 0 1995 2000 2005 2010
Poor feedback, no behavior change Energy Use Decisions Monthly Energy Bills nofeedback
My house 8000 Competition – who can reduce the most? 7000 6000 5000 kg CO2 per year 4000 Paul’s house 3000 George’s house 2000 1000 0 1995 2000 2005 2010
Energy Use Energy Use Decisions Decisions Social feedback, behavior change socialfeedback
competition begins 8000 7000 6000 Bruce 5000 kg CO2 per year 4000 Paul 3000 2000 George 1000 0 1995 2000 2005 2010 www.visibleenergy.com
Tons CO2e year-1 Your Department: You:
Real-time feedback, ~15% conservation Energy Use Decisions Dynamic feedback Real-time energy monitoring
green That, madam? That’s just the invisible hand of the market http://www.climatecartoons.org.uk/invisiblehand.html
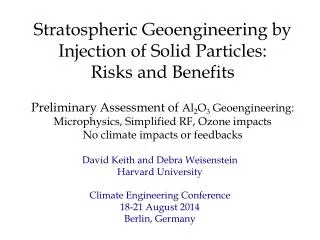
Geoengineering the climate “The possibilities of deliberately bringing about countervailing climatic changes therefore need to be thoroughly explored.” THE WHITE HOUSE NOVEMBER 1965
“One idea is to counteract warming by tossing small particles into the stratosphere…potential to cool the earth within months….” Which is the more environmentally sensitive thing to do: let the Greenland ice sheet collapse and polar bears become extinct, or throw a little sulfate in the stratosphere? The second option is at least worth looking into.”
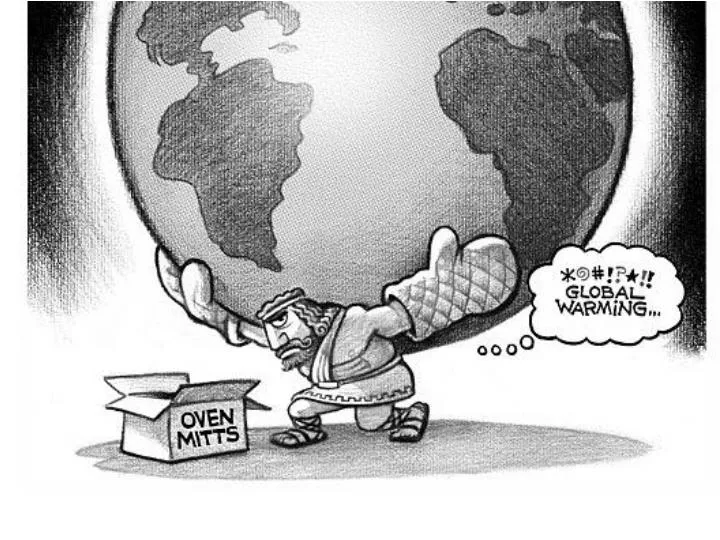
If man-made technologies are capable of heating the planet, they are probably capable of cooling it down again. Welcome to "geo-engineering", which holds that, rather than trying to change mankind's industrial habits, it is more efficient to counter the effects, using planetary-scale engineering. Will it work?
ºC -6 -4 -2 0 2 4 6 GeoengineeringTemperature change 2 x CO2 2 x CO2and1.8% reduction insolar intensity Ken Caldeiraet al.
Are the side effects of geoengineering worse than those from unmitigated warming? Should we geoengineer the climate?
Geoengineering instead of mitigation CO2 concentration Radiative Forcing Increasing albedo (geoengineering) 2000 2050 2100 from David Keith
Geoengineering to take theedge off the heat Geoengineering instead of mitigation CO2 concentration CO2 concentration Radiative Forcing Increasing albedo (geoengineering) Increasing albedo (geoengineering) 2000 2050 2100 2000 2050 2100 from David Keith
Manipulating Ocean Carbon Storage - Iron Fertilization“Give me half a tanker filled with iron, and I’ll give you another ice age” John Martin
Planktos … lost $558,127 in the quarter ended September 2007, ...lost a total of $2.6 million since it started business. The name "Planktos" comes from the Greek word for "wander," …. The company Planktos has also wandered from one business model to another over the nine years it has been around.
Plant trees to slow warming? stores more C, but what about other effects?
Without trees, CO2 is higher but temperatures are slightly cooler,because of albedo Atmospheric CO2 Temperature A2
More C stored, but policy penalizes thinning Less C stored, but policy ignores loss • Policy & economic implications: • C credit for fuels reduction, • funds for fire risk reduction Hurteau, Koch, & Hungate (2008), Frontiers in Ecology and Environment
Incorporating Risk • Now, tC= tC • Some C is more vulnerable • So, we developed a metric to value C based on risk • Discount value based on probability of loss C = Cs x [1-(FRCC x (1 – mFRI/Permanence)] Hurteau, Hungate, and Koch (2009) Carbon Balance and Management
Risk-adjusted value coefficients: proportion of market value Hurteau, Hungate, and Koch (2009) Carbon Balance and Management
What we can do • Emphasize efficiency • Know your carbon footprint • Change lifestyle where you can • Purchase green energy • Build green • Reduce what you can, offset the rest