Download
1 / 69
690 likes | 885 Vues
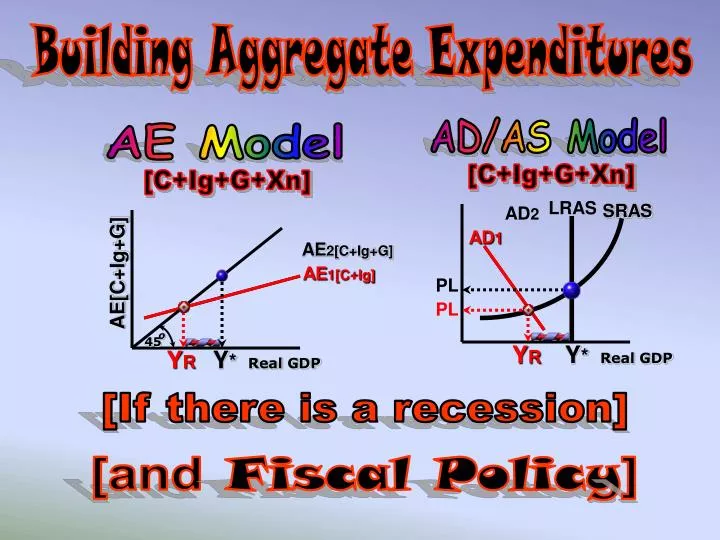
o. 45. Building Aggregate Expenditures. AD/AS Model. AE Model. [C+Ig+G+Xn]. [C+Ig+G+Xn]. SRAS. LRAS. AD 2. AD 1. AE 2[C+Ig+G]. AE[C+Ig+G]. AE 1[C+Ig]. PL. PL. Y R Y * Real GDP. Y R Y * Real GDP. [If there is a recession]. [and Fiscal Policy ]. o. 45.

E N D
o 45 Building Aggregate Expenditures AD/AS Model AE Model [C+Ig+G+Xn] [C+Ig+G+Xn] SRAS LRAS AD2 AD1 AE2[C+Ig+G] AE[C+Ig+G] AE1[C+Ig] PL PL YR Y* Real GDP YR Y* Real GDP [If there is a recession] [and Fiscal Policy]
o 45 Building Aggregate Expenditures AE Model AD/AS Model [C+Ig+G+Xn] [C+Ig+G+Xn] [If there is inflation] LRAS SRAS AD1 AE1[C+Ig1] AD2 AE2[C+Ig2] PL AE[C+Ig+G] PL Y* RGDP YI Y* RGDP YI Weaknesses [Limitations] of the AE Model • Does Not Show Price Level Changes • Does not show Demand-Pull Inflation • Does Not Deal With Cost-Push Inflation [Stagflation] • It ignores premature demand-pullinflation[Inflation just before FE GDP] • It does not allow for “self-correction”
Building AE 1 [C+Ig, "private-closed", a simple economy] In this Chapter we will learn: 1. How changes in income affect consumption [& saving]. 2. About factors other than income that can affect consumption [like wealth or expectations] 3. How changes in real interest rates affect investment. 4. How factors other than the real interest rate can affect investment (like profit expectations or stock on hand). 5. Why changes in investment increase or decrease real GDP by a multiple amount due to the multiplier effect.
Building AE 1 [Simple[Basic] economy to Complex economy] Private - closed [C + Ig] Private-closed Private-open [C + Ig + Xn] Private-open [C+Ig+G+Xn] Mixed - open Mixed-open AE3 (C+Ig+G+Xn) (Complex Economy) [Mixed-open] (AE3)630 AE2 (C+Ig+Xn) (Private-open) [X(40)-M(20)] (AE2)550 AE1(C+Ig)[Basic Economy][Private(noG)-Closed(no X or M)] +20 G S +20 Xn Consumption AE(C+Ig2) (AE1)470 500 +20 Ig AE(C+Ig1) C=390 AE(C+Ig) +80 +80 +80 10 Ig 460 0 Real GDP 390470550630 460 500 Real GDP YRY* “ME” = 4
AE[C+Ig] [“Basic” or “Simple” economy] Building the AE Model C + Ig Multiplier=4 Private - Closed Consumption Equilibrium 470 AE[C+ Ig](billions ofdollars) Ig= $20 Billion 450 C =$450 Billion 390 + 20 Ig +60 more +20 370 [increase 80] 45º o Real GDP 370 390410 430 450 470 490 510 530 550 GDP will increase by a “multiple” of 4 & that is why it is called the “multiplier”.
[Income change, movement from point to point] o 45 Change in QC [or QS] SAVING Consumption Breakeven So, the key to a change in QC(QS) is a change in ? Consumption C2 C1 DISSAVING [Negative saving] o DI2 Disposable Income DI3 DI1 S SAVING Saving o Disposable Income S DISSAVING
o 45 Increase in Consumption [Decrease in Saving] [shift/whole curve/non-income] C2 May be caused by: Increase in wealth Decrease in PL Expect. PL incr. Expect. of positive Y Expect. of shortages Decrease in debt *Decrease in taxes *Decrease in taxes increases both C & S C1 Increases in consumption means… Consumption o Disposable Income Decrease in saving I’ll buy more and save even more. S1 S2 Saving o Disposable Income
o 45 Decrease in Consumption [Increase in Saving] [shift/whole curve/non-income] May be caused by: Decrease in wealth Increase in PL Expect. PL decrease Expect. neg. future Y Increase in debt *Increase in taxes *Increase in taxes decreasesboth C & S C1 C2 Consumption Decreases in consumption means… o Disposable Income Increase in saving S2 S0 Saving o Disposable Income
Consumption and Saving Global Perspective Average Propensities to Consume Select Nations GDPs Average Propensities to Consume .80 .85 .90 .95 1.00 United States Canada United Kingdom Japan Germany Netherlands Italy France .963 .958 .953 .942 .896 .893 .840 .833 Source: Statistical Abstract of the United States, 2006
Real Interest Rate [Nominal I.R.–inflation rate=Real I.R.] - 2% 8% 6% = Real Interest Rate Inflation Premium Nominal Interest Rate - =
Marginal Efficiency of Investment [MEI] [If expected returns equal or exceed the real interest rate of interest, the firm will normally make the investment.] [One firm’s demand curve for investment] 30% 25% 20% 15% 10% 5% MEI = 27% MEI=20% MEI=15% Real Interest Rate MEI=12% MEI = 7% Add new wing to factory $1 mil. Acquire additional power facilities $1.5 mil. Purchase machines $1.5 mil. Renovate plant $2 million Install computer system $1 mil. 0 1 23456 [QID] Quantity of Investment Demanded (millions)
[MEI] 25% 15% 10% Change in QID [interest rate change, point to point movements] Macro Economy’s AD Curve for Ig Firms invest with their profits & alsoborrow(5%) to invest.(10%) 20% [A 20% cost of funds attract $100 billion of investment Real Interest Rates I.R. QID 5% DI (MEI) A 5% cost of funds attracts $200 bil. Ig 150 200 100 0 50 250 QID1 QID2
Should A New Drill Press Be Purchased? Single Firm • Positive profit expectationsand thereal interest • rate are the most important determinantsofinvestment. • Drill Press - $1,000 • A. Expected gross profits = $1,100 or a 10% return. • [$100/$1,000 x 100 = 10%] • [At 8%, invest in the drill; at12%, don’t invest] • B.Real interest rate[nominal interest rate-inflation]
(Interest rate change, point to point movement) [Inverserelationship betweenreal interest rate and QID] Change in Quantity of Investment Demanded [QID] DI 16 14 12 10 8% 6 4% 2 0 Firms will undertake all investments [additions to plant, equipment, inventory, and residential construction]which have an expected rate of net profit greater than [or equal to] the real rate of interest. Expected rate of return, r, and interest rate, i (percents) Monetary Policy– by lowering interest rates, the Fed can increase Ig & employment. • 1015202530 35 40 • QID Investment (billions) QID
Increase in Investment • Positive profit expectations • Scarcity of inventory • Technology [innovation] • Decrease in production costs • Decrease in business taxes CHANGE [Shift] IN INVESTMENT [curve] I2 I1 8% QID2 QID1
Ig on the AE graph will be independent [not influenced] by income. Investment decisions are forward-looking and made months ahead. INVESTMENT DEMAND SCHEDULE Investment Demand Curve Investment Schedule Ig independent of Y DI Ig 20 Expected rate of return, r, and real interest rate, i (percents) Investment (billions of dollars) 8 20 20 20 20 Y1 Y2 Y3 Investment (billions of dollars) Real Domestic Product, GDP (billions of dollars)
NS 1-6 “Closed” and “private” [C+Ig] “Simple Economy” “Open” & “private” [C+Ig+Xn] “Open” & “mixed” [C+Ig+G+Xn] “Complex Economy” C+Ig Assumptions:No internat. trade or “G”; no business saving; depreciation & NFFIEUS are 0; PL is constant [Keynesian] [GDP = DI] Closed 1. The most important determinant of consumer spending is (wealth/indebtedness/income). 2. As aggregate income increases, consumption and saving both (increase/decrease). 3. The (consumption/saving) schedule shows how much households plan to consume at various income levels. 4. Dissaving occurs where consumption (exceeds/is less than) Y. 5. If the consumption schedule shifts upward [not caused by a tax change], the saving schedulewill shift(upward/downward). 6. (The expectation of a recession/A change in consumer incomes/ An expected change in the price level) will not cause the consumption curve to shift.
Now, Let’s Move To The Hard Stuff!
What in the world is AE? APCandAPS APC - percentage of income (“Y”) consumed. APC = C/Y(DI)=$48,000/$50,000 = .96 APS = S/Y(DI)= $2,000/$50,000 = .04 APS – percentage of income (“Y”) saved. AE=GDP APC=C/Y 1 APC = C/Y=$52,000/$50,000 = 1.04 APS = S/Y= -$2,000/$50,000 = -.04 1 “Econ, Econ, APS=S/Y “High maintenance Econ teacher”
ME=1/MPS MPC,MPS, & theMultiplier MPC - % change in Y consumed. MPS - % change in Y saved. MPC = C/ Y = $750/$1,000 = .75 MPS = S/ Y = $250/$1,000 = .25 Multiplier [1/MPS]=1/.25=$1/.25 = “ME” of 4 [MPC is important for G in policy making decisions.] *The ME is the reciprocal of the MPS. The “ME” works like a concentric circle. 15bil. 8.5 bil. 11.25 bil. $20billion“G” [with ME of 4]
MPC of 75%G spends$200 billionon the highways. 1st Round Causes Biggest Splash Highway workers save 25% of $200 billion [$50 billion] & spend 75% or $150 billion on boats. Boat makers save 25% of $150 billion [$37.50 billion] and spend 75% or $112.50 billion on iPhones, etc.
ME = 1/MPS, 1/.25 = $1/.25 = ME of 4 ME is 4 & we are short of Y*[$860] by $60 billion o 45 AE[C+Ig+G] Equilibrium AE[C+Ig] AE[C+Ig+G](billions ) G= $15 Billion Incr G $15 +60 Recess. Spending gap Recess. Gap o Real GDP 800860 YrY* Recessionary GDP Gap “M” = Y/ E = 60/15 = 4
Now, let’s look at the Tax Multiplier [MT] MT= -MPC/MPS, -.75/.25 = ME of -3 MT is -3 & we are shortof Y*[$860]by $60 billion -3 x ? will close a $60 billion GDP gap? With this situation, [short of Y* by $60 bil.], we would need to decrease taxes by $20 billion, with a multiplier of-3. [-3 x -$20 = $60]
MT= -MPC/MPS, -.75/.25 = MT of -3 MT is -3 & we are short of Y*[$860] by $60 billion o 45 AE[C+Ig+G] Equilibrium AE[C+Ig] AE[C+Ig+G](billions ) Decr T $20 +60 -3 x -$20 = $60 billion Recess. Spending gap Recess. Gap o Real GDP 800860 YrY* Recessionary GDP Gap
MEandMT Let’s say that we have a Recessionary GDP [Output] Gapof $60 billion & the MPS is .50. Let’s correct the economy by first using: 1.) Government spending, and then using a 2.) Tax cut With a MPS of .50, what is the ME? 1/.5 = With a MPS of .50, what is the MT? -.5/.5 = -
ME = 1/MPS, 1/.50 = $1/.50 = ME of 2 ME is 2 & we are short of Y*[$860] by $60 billion o 45 AE[C+Ig+G] Equilibrium AE[C+Ig] AE[C+Ig+G](billions ofdollars) G= $30 Billion + 30 G +60 -2 x -$30 = $60 billion Recess. Spending gap Recess. Gap o Real GDP 800 YR 860 Y* Recessionary GDP Gap “M” = Y/ E = 60/30 = 2
MT = -MPC/MPS, -.50/.50 = MT of -1 MT is -1 & we are short of Y*[$860] by $60 billion o 45 AE[C+Ig+G] Equilibrium Now, let’s look at correcting this $60 billion recessionary gap with a tax cut. MPS=.5 AE[C+Ig] AE[C+Ig+G](billions ofdollars) Decr. T by $60 +60 -1 x -$60 = $60 billion Recess. Spending gap Recess. Gap o 800 YR Real GDP 860 Y* Recessionary GDP Gap
ME = 1/MPS, 1/.50 = $1/.50 = ME of 2 ME is 2 & we are beyond Y*[$840] by $40 billion o 45 AE[C+Ig+G] 2 x -? [Decrease in G] = -40 AE[C+Ig-G] Equilibrium Inflationary Spending gap=$20 B AE[C+Ig+G](billions ofdollars) -20 G -40 Inflat. Gap o Real GDP 840 880 Y*YI Inflationary GDP Gap
MT = -MPC/MPS, -.50/.50 = MT of -1 MT is -1 & we are beyond Y*[$840] by $40 billion AE[C+Ig+G] AE[C+Ig+G] Equilibrium Now, with a MT of 1, we would need a tax increase of how much to close the $40 bil. inflationary gap? AE[C+Ig+G](billions ofdollars) Incr T $40 -1 x ? [incre in T]= -40 -40 Inflat. Gap 45º o Real GDP $40 billion tax increase 840 880 Y*YI Inflationary GDP Gap
MPC 1/MPS = ME .90 1/.10 = 10 .80 1/.20 = 5 .75 1/.25 = 4 .60 1/.40 = 2.5 .50 1/.50 = 2 ME ME [Change in Ig, G, or Xn] = 1/MPS The ME is always positive. Reasons why the “Simple Multiplier” is not as strong as indicated. 1. Some spending will be on imports, reducing the size of the M. 2. It ignores PL changeswhich reduce the multiplier. 3. It ignores taxes which reduce the multiplier.
MT MT [Change in Taxes] = MPC/MPS The MT is always negative. MPC -MPC/MPS = MT .90 -MPC/.10 = -9 .80 -MPC/.20 = -4 .75 -MPC/.25 = -3 .60 -MPC/.40 = -1.5 .50 -MPC/.50 = -1 When the G gives a tax cut, the MT is smaller than the MEbecause a fraction[MPS] is savedand only the MPC is initially spent. So, the MT = -MPC/MPS.
MBB [‘1” X Chg In G] Always “1” Why is the MBB always “1”? 1/MPS + -MPC/MPS = 1- MPC/MPS = MPS/MPS = “1” Let’s say the MPC is .90 1/.10 + -.90/.10 = 1- .90/.10 = .10/.10 = “1” Or, Let’s say the MPC is .75 1/.25 + -.75/.25 = 1- .75/.25 = .25/.25 = “1”
Notice the 2ndround with .9 [10]versus.5 [2] MT=-MPC/MPS MBB=1 ME=1/MPS G 2nd Round at .9 90% .9 10 -9 1 2nd Round at .5 50% When Arlington gets the Super Bowl in 2012, it will have an estimated economic impact of $419 million. 200,000 people will visit the area. .8 5 -4 1 .75 4 The 2008 Final Four in San Antonio brought 57,000 visitors[$223 per day], $47 M in 4 days &$120 M trickle effect. The Texas-Oklahomagamebrings $34 mil to D-FW. 2007 Cotton Bowl brought $30 million to D-FW. Super Bowl brought $336 million to Houston. Fiesta Bowl for national title brought in $85 million. Big 12 Tournament brought $45 million to D-FW -3 1 .60 2.5 -1.5 1 .5 2 -1 1 Thelarger the MPC, thesmaller the MPS, and the greater the multiplier. This is the “simple multiplier” because it is basedon a“simple modelof theeconomy”. OU
Super Bowl - $336 Million For Houston in 2004 • $150 - Parking ratesaround the stadium • $500-$600 per Super Bowl ticket [$2,000-$6,000on E-Bay for a seat] • $12,000 – cost ofSuper Bowltrophy • $2.3 million – 30 second ad • $50,000 – Super Bowl Ring • 68,000to each player on thewinning team • $36,500 to each player on the losing team. • $3.35 million to the winning team • $2.59 million to the losing team • Hotels - $69 M; bars & restaurants-$27 M; entertainment-$15M; transportation-$15 M; and retail sales-$41 M Reliant Stadium
Step by Step Working of “Multiplier” [MPC is .5] Government increases spending by$1 billion with a multiplier of 2 $1,000.00 500.00 250.00 125.00 62.50 31.25 15.625 7.8125 3.90625 1.953125 .9765625 .48828125 .244140625 .1220703125 .06103515625 .030517578125 .015258789062 $2,000,000,000 On new highways Highway workers buy new boats Boat builders buy plasma TVs TV factory workers buy new cars Auto workers buy “wife beater shirts” Apparel workers spend $ on movies Movie moguls spend money on Christina Agulera songs. “What A Girl Wants.” [Increased by a multiple of 2]
Let’s Go To Padre Island and Party With The Multiplier These are Texas A&M students at Padre. UT student • During spring break, college students like to head to Padre Island. The “multiplier” is getting ready to work. • With dollars in their pockets, the students spend money on food and drink, motel rooms, dance clubs, etc. These dollars raise total income there by some multiple of itself. • College students buy pizzas, beer, and sodas. The people who sell these items find their incomes rising. They spend some fraction of their increased income, which generates additional income for others. • If the students spend $8 million at Padre and the MPC is .60, then college students will increase income in Padre by $20 million. • When the networks show scenes on the beach, the average person simply sees college students having a good time. • But – economists see the multiplier at work, generating higher levels of income for many of the residents of Padre Island.
And - What About The Multiplier in Reverse If business activity slows, then sales of houses and autos decrease. Home construction workers and auto workersget laid off. Auto companies cancel their orders for steel and steel workers laid off. Furniture sales are down so some of thefurniture workers are laid off. Laid off people don’t buy new clothes or cars so more lay-offs. They also don’t eat out as much so some restaurant workers laid off. Company profits are down, depressing stock prices, making people poorer, so they buy even less. And so it goes, the multiplier in reverse.
NS 7 – 10 7. The APC indicates the percent of total income that will be (consumed/saved). 8. The MPC is the fraction of a change in income which is (spent/saved). 9. The greater is the MPC, the (larger/smaller) the MPS, and the (larger/smaller) the multiplier. 10. With a MPS of .4, the MPC will be (.4/.2/.6) and the multiplier will be (2/2.5/4). Multiplier – As the money goes from one person, to another, to another…
[C+Ig] (private-closed) [C+Ig+Xn] (private-open) [C+Ig+G+Xn] (mixed-open) Building AE 1 [From “Simple” to “Complex” economy] Private Closed Private Open Open Mixed “ME” = 4 S AE3 (C+Ig+G+Xn) (Complex Economy) [Mixed-open] (AE3)550 AE1(C+Ig)[Basic Economy][Private(no G)-Closed(no X or M)] AE2 (C+Ig+Xn) (Private-open) [X(10)-M(10)] +20 G (AE2)470 (AE1)470 Consumption + Xn +20 Ig C=390 +80 +80 InjectionsLeakages 1. Investment [20]= 1. Saving[20] 2. Exports [10]=2. Imports[10] 3. Government [20]=3. Taxes [20] 45º 0 390470550 Real GDP Notice that the injections are autonomous (independent) of Y
How to figure the MPC & MPS [MPC = C/ Y] [MPS = S/ Y] S SAVING D Consumption Consumption C2 C MPC=? BC/EF[or AB] A C1 B MPS=? CD/EF Dissaving 45 o F Disposable Income H E
o 45 Review AE1[C+Ig] H Consumption $1,000 AE [C+Ig] $700 I J $400 P $100 2004001,000bil. 0 NQK Real GDP Consumption will be equal to income at income level ? $400 With Ig[C+Ig], the MPC is? PI/QK The MPS is ? HI/QK What income level represents “dissaving”? $200
o 45 NS 11-16 D Consumption 1,000 Consumption 700 400 11. TheAPCis one at letter (A/B/C/D). 12. TheMPCis equal to (AE/OE or BC/EF[or AB]). [moving from OE(400) to OF(1,000)] 13. At income level“OF”the volume ofsavingis (CB/CD). 14.Consumption will be equal to incomeat incomelevel (OH/OE). 15. The economy isdissavingat income level (OH/OF). 16.TheMPSis (CD/EF or CB/EF). [moving from OE to OF] C A B 200 400 1,000 0 F H E Income
An Increase in G of $20B is more expansionary than adecrease in T of $20 B [If the MPC is .75,ME is 4but theMT is only 3] Incr G spending by $20 bil. “ME” of 4 [1/.25] [20 x 4 = $80] AE2(C+Ig+G) AE AE1(C+Ig) “Big 12” Tournament brings $45 million to the DFW economy. Let’s see, anyone’s spending (G,Ig, or Xn) becomes someone else’s income, so there will be an increase in “C”. +20G +80 YRF* 500580 AAC “Tax cut” of $20 billion “MT” = -3 [-.75/.25] x -20 = $60 AE AE2 AE1 +20T +60 [Need a 25% larger “Tax cut” to get to $580] “Tax cut of -$25.67 billion x -3 = $80] YRY* 500 580 560
Increase in G of $40Billion with MPS of .5 1st Round = $40 billion spent on the highways 2ndRound=$20 billion on motorcycles The multiplier is the multiple in which an initial change in aggregate spending will alter total spending after an infinite # of spending cycles. Total spending change = M X new spending injection. 3rd Round, only $10 billion spent oncorvettes
Decrease in Taxes of $40 B with MPS of .5 With MPS of .50, $20 is saved & & only $20 bil is spent 1st round. Leakage of 50% [saving of $20 bil.] in the first round 2nd Round: only $10 bil. is spent. 3rd Round only $5bil. is spent.
Balanced Budget Multiplier(“1”) [Increase G & T by $20 billion] $20G$20T ME of 2&MT of -1 ME of “2”[So MT is -“1”] “G” 40 AE2[C+Ig] -20 [+20] “T” AE1[C+Ig] AE ME of 5&MT of 4 +20G&T ME of “5”[So MT is -“4”] “G” 100 +$20 “T” [+20] -80 $600$620 ME of 10&MT of 9 ME of “10”[So MT is -“9”] MBB= 1 x G 1 x $20 “G” 200 -180 “T” [+20]
1993 Macro Free Response Long Question • Suppose that thefollowing conditions describe the current U.S. economy. • - The unemployment rate is 5% • - Inflation is 2% • - Real GDP is growing at the rate of 3% • I. First assume that the federal government increases its spending and • increases taxes so as to maintain a balanced budget. Using AD/AS • analysis, explain theshort-run effects of these policies on each of the following. • (a) Output/employment • (b) The price level • (c) Interest rates LRAS SRAS PL D2 D1 With G&T increased by the same amount, & since 1st round G is not subject to the MPS but T is, this would result in an“expansionary fiscal policy”and increase GDP by the same amount as the equal increase in G and T, which would increase AD. 3% 2% RGDP 5% 4.8% This increase in AD would increase GDP, employment and price level. The increase in price level *increases demand for money and this increases interest rates.
Balanced Budget Multiplier [$20 billion] [“T”affects AD indirectly thru “C”;“G” affects AD directly] GDP=$80 The increase in “G” flows directly into the economy. +$20 Net Change in GDP = The increase in “T” means we would have consumed $15 and kept $5 in our pockets. GDP= -$60 G $20 Sa= -$5 T $20 Ca= -$15 ME = 1/MPS ME = 1/.25 = 4 So, 4 x $20 = $80 MT = -MPC/MPS = -.75/.25=-3 So, -3 x $20 = -$60 AS AD2 AD1 PL $470 billion $490 billion
TheME,MT, &MBBMultipliers ME[C, Ig, G, or Xn] =1/MPS=1/.25=4 So,G increase of $20 bil.willincr Y by $80 bil.[+$20x4=$80] And aG decrease of $20bil.willdecrease Y by $80 bil.[-$20x4=-$80 bil.] MT = -MPC/MPS = -.75/.25 = -3 So,Tdecreaseof $20 bil.willincr Y by $60 bil.[-$20 x-3=$60] And aT increase of $20 bil.willdecr Y by $60 bil.[+$20x-3=-$60] MBB = 1 X (G) So, anincrease in G&T of $20 bil.will incr Y by $20bil.[1X$20=$20] And adecrease in G&T of $20 bil.willdecr Y by $20 bil.[1X-$20=-$20] Anyincrease in expenditures x theM will increase GDP.. Any decrease in expenditures x the M will decrease GDP.
INSTRUCTIONS FOR THE NEXT FOUR AE SLIDES • We willstart at $500 equilibrium GDPon each. • Of the three items(equilibrium GDP, change • in expenditures, & MPC), you will be given • twoand if you know 2 you can always figure • out the 3rd. For instance, if you knew that • equilibrium GDP increased by $400 and the • multiplier was 4, then the change in expenditures • was obviously $100. • Except for 6, 9, 15, & 18, you will increase • equilibrium GDPabove $500, because there • is an increase in G, or a decrease in T, or • an equal increase in G&T. • Ex: With MPC of .75 & therefore a ME of 4, • an increase in G of $20 means +$20 x 4 = $580 • 4. On questions 6, 9, 15, & 18, you will decrease equilibrium • GDP below $500 because you are either decreasing G, • increasing T, or there is an equal decrease in G & T. • Ex: With MPC of .75 & therefore a ME of 4, a decrease • in G of $20 means -$20 x 4 = -$80; so ends up at $420. Inflationary spending gap AE AE2 AE1 AE3 E2 E1 E3 500 Recessionary spending gap Inflationary GDP gap Recessionary GDP gap