Download
1 / 53
530 likes | 664 Vues
Introducing Statistical Inference with Resampling Methods (Part 1). Allan Rossman, Cal Poly – San Luis Obispo Robin Lock, St. Lawrence University. George Cobb ( TISE , 2007).

E N D
Introducing Statistical Inference with Resampling Methods (Part 1) Allan Rossman, Cal Poly – San Luis Obispo Robin Lock, St. Lawrence University
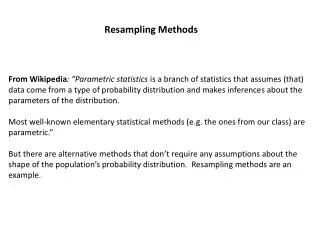
George Cobb (TISE, 2007) “What we teach is largely the technical machinery of numerical approximations based on the normal distribution and its many subsidiary cogs. This machinery was once necessary, because the conceptually simpler alternative based on permutations was computationally beyond our reach….
George Cobb (cont) … Before computers statisticians had no choice. These days we have no excuse. Randomization-based inference makes a direct connection between data production and the logic of inference that deserves to be at the core of every introductory course.”
Overview • We accept Cobb’s argument • But, how do we go about implementing his suggestion? • What are some questions that need to be addressed?
Some Key Questions • How should topics be sequenced? • How should we start resampling? • How to handle interval estimation? • One “crank” or two (or more)? • Which statistic(s) to use? • What about technology options?
Format – Back and Forth • Pick a question • One of us responds • The other offers a contrasting answer • Possible rebuttal • Repeat • No break in middle • Leave time for audience questions • Warning: We both talk quickly (hang on!) • Slides will be posted at: www.rossmanchance.com/jsm2013/
How should topics be sequenced? • What order for various parameters (mean, proportion, ...) and data scenarios (one sample, two sample, ...)? • Significance (tests) or estimation (intervals) first? • When (if ever) should traditional methods appear?
How should topics be sequenced? • Breadth first • Start with data production • Summarize with statistics and graphs • Interval estimation (via bootstrap) • Significance tests (via randomizations) • Traditional approximations • More advanced inference
How should topics be sequenced? ANOVA, two-way tables, regression More advanced normal, t-intervals and tests Traditional methods hypotheses, randomization, p-value, ... Significance tests bootstrap distribution, standard error, CI, ... Interval estimation mean, proportion, differences, slope, ... Data summary experiment, random sample, ... Data production
How should topics be sequenced? 1. Ask a research question 2. Design a study and collect data 3. Explore the data 4. Draw inferences 5. Formulate conclusions 6. Look back and ahead • Depth first: • Study one scenario from beginning to end of statistical investigation process • Repeat (spiral) through various data scenarios as the course progresses
How should topics be sequenced? • One proportion • Descriptive analysis • Simulation-based test • Normal-based approximation • Confidence interval (simulation-, normal-based) • One mean • Two proportions, Two means, Paired data • Many proportions, many means, bivariate data
How should we start resampling? • Give an example of where/how your students might first see inference based on resampling methods
How should we start resampling? • From the very beginning of the course • To answer an interesting research question • Example: Do people tend to use “facial prototypes” when they encounter certain names?
How should we start resampling? • Which name do you associate with the face on the left: Bob or Tim? • Winter 2013 students: 46 Tim, 19 Bob
How should we start resampling? • Are you convinced that people have genuine tendency to associate “Tim” with face on left? • Two possible explanations • People really do have genuine tendency to associate “Tim” with face on left • People choose randomly (by chance) • How to compare/assess plausibility of these competing explanations? • Simulate!
How should we start resampling? • Why simulate? • To investigate what could have happened by chance alone (random choices), and so … • To assess plausibility of “choose randomly” hypothesis by assessing unlikeliness of observed result • How to simulate? • Flip a coin! (simplest possible model) • Use technology
How should we start resampling? • Very strong evidence that people do tend to put Tim on the left • Because the observed result would be very surprising if people were choosing randomly
How should we start resampling? • Bootstrap interval estimate for a mean Example: Sample of prices (in $1,000’s) for n=25 Mustang (cars) from an online car site. How accurate is this sample mean likely to be?
Original Sample Bootstrap Sample
BootstrapSample Bootstrap Statistic BootstrapSample Bootstrap Statistic Original Sample Bootstrap Distribution • ● • ● • ● ● ● ● Sample Statistic BootstrapSample Bootstrap Statistic
We need technology! StatKey www.lock5stat.com/statkey
Chop 2.5% in each tail Chop 2.5% in each tail Keep 95% in middle We are 95% sure that the mean price for Mustangs is between $11,930 and $20,238
How to handle interval estimation? • Bootstrap? Traditional formula? Other? • Some combination? In what order?
How to handle interval estimation? • Bootstrap! • Follows naturally • Data Sample statistic How accurate? • Same process for most parameters • : Good for moving to traditional margin of error by formula • : Good to understand varying confidence level
Sampling Distribution Population BUT, in practice we don’t see the “tree” or all of the “seeds” – we only have ONE seed µ
Bootstrap Distribution What can we do with just one seed? Bootstrap “Population” Chris Wild - USCOTS 2013 Use bootstrap errors that we CAN see to estimate sampling errors that we CAN’T see. Grow a NEW tree! µ
How to handle interval estimation? • At first: plausible values for parameter • Those not rejected by significance test • Those that do not put observed value of statistic in tail of null distribution
How to handle interval estimation? • Example: Facial prototyping (cont) • Statistic: 46 of 65 (0.708) put Tim on left • Parameter: Long-run probability that a person would associate “Tim” with face on left • We reject the value 0.5 for this parameter • What about 0.6, 0.7, 0.8, 0.809, …? • Conduct many (simulation-based) tests • Confident that the probability that a student puts Tim with face on left is between .585 and .809
How to handle interval estimation? • Then: statistic ± 2 × SE(of statistic) • Where SE could be estimated from simulated null distribution • Applicable to other parameters • Then theory-based (z, t, …) using technology • By clicking button
Introducing Statistical Inference with Resampling Methods (Part 2) Robin Lock, St. Lawrence University Allan Rossman, Cal Poly – San Luis Obispo
One Crank or Two? • What’s a crank? A mechanism for generating simulated samples by a random procedure that meets some criteria.
One Crank or Two? • Randomized experiment: Does wearing socks over shoes increase confidence while walking down icy incline? • How unusual is such an extreme result, if there were no effect of footwear on confidence?
One Crank or Two? • How to simulate experimental results under null model of no effect? • Mimic random assignment used in actual experiment to assign subjects to treatments • By holding both margins fixed (the crank)
One Crank or Two? • Not much evidence of an effect • Observed result not unlikely to occur by chance alone
One Crank or Two? • Two cranks Example: Compare the mean weekly exercise hours between male & female students
One Crank or Two? 30 F’s 20 M’s Resample (with replacement) Combine samples
One Crank or Two? 30 F’s 20 M’s Resample (with replacement) Shift samples
One Crank or Two? • Example: independent random samples • How to simulate sample data under null that popn proportion was same in both years? • Crank 2: Generate independent random binomials (fix column margin) • Crank 1: Re-allocate/shuffle as above (fix both margins, break association)
One Crank or Two? • For mathematically inclined students: Use both cranks, and emphasize distinction between them • Choice of crank reinforces link between data production process and determination of p-value and scope of conclusions • For Stat 101 students: Use just one crank (shuffling to break the association)
Which statistic to use? Speaking of 2×2 tables ... • What statistic should be used for the simulated randomization distribution? • With one degree of freedom, there are many candidates!
Which statistic to use? • #1 – the difference in proportions • ... since that’s the parameter being estimated
Which statistic to use? • #2 – count in one specific cell • What could be simpler? • Virtually no chance for students to mis-calculate, unlike with • Easier for students to track via physical simulation
Which statistic to use? • #3 – Chi-square statistic Since it’s a neat way to see a 2-distribution
Which statistic to use? • #4 – Relative risk
Which statistic to use? • More complicated scenarios than 22 tables • Comparing multiple groups • With categorical or quantitative response variable • Why restrict attention to chi-square or F-statistic? • Let students suggest more intuitive statistics • E.g., mean of (absolute) pairwise differences in group proportions/means