Download
1 / 22
220 likes | 255 Vues
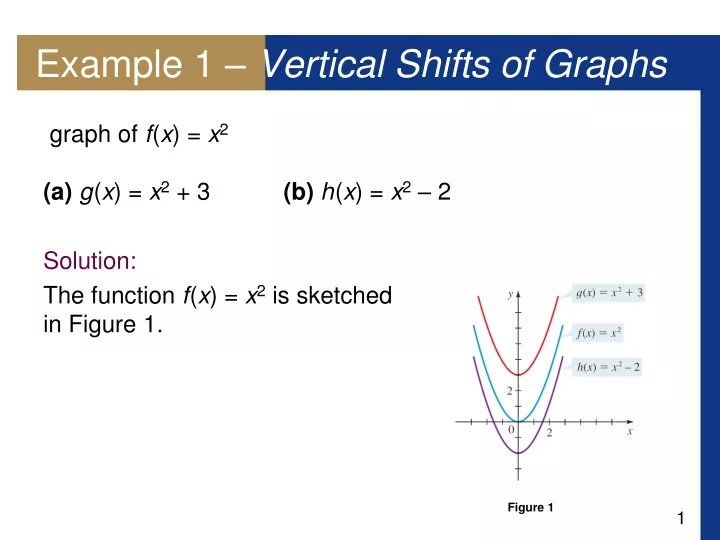
Example 1 – Vertical Shifts of Graphs. graph of f ( x ) = x 2 (a) g ( x ) = x 2 + 3 (b) h ( x ) = x 2 – 2 Solution: The function f ( x ) = x 2 is sketched in Figure 1. Figure 1. Vertical Shifting.

E N D
Example 1 – Vertical Shifts of Graphs • graph of f(x) = x2(a) g(x) = x2 + 3 (b) h(x) = x2 – 2 • Solution: • The function f(x) = x2 is sketched in Figure 1. Figure 1
Vertical Shifting • So we obtain the graph of y = f(x) + c simply by shifting the graph of y = f(x) upward c units. Similarly, we obtain the graph of y = f(x) – c by shifting the graph of y = f(x) downward c units.
Example 2 • The graphs of g and h are sketched in Figure 2. Figure 2
Horizontal Shifting • The following box summarizes these facts.
Example 4 – Reflecting Graphs • Study the graph of each function. • What is the effect of multiplying y = x2 by ( -1)? Figure 4
Example 4 – Solution cont’d • Study the graphs of y = . And The graph ofg(x) = • What is the effect of multiplying the radicand x by (-1) ? • Note that the domain of the function g(x) = is {x|x 0}. Figure 5
Reflecting Graphs • The following box summarizes these observations.
Vertical Stretching and Shrinking • Suppose we know the graph of y = f(x). How do we use it to obtain the graph of y = cf(x)?The y-coordinate of y = cf(x) at x is the same as the corresponding y-coordinate of y = f(x) multiplied by c.
Example 5 – Vertical Stretching and Shrinking of Graphs The result is the narrower parabola in Figure 6 • (a) The graph of g is obtained by multiplying the y-coordinate of each point on the graph of f by 3. That is, to obtain the graph of g, we stretch the graph of f vertically by a factor of 3.
Example 5 – Solution cont’d • . • (b) The graph of h is obtained by multiplying the y-coordinate of each point on the graph of f by That is, to obtain the graph of h, we shrink the graph of fvertically by a factor of The result is the wider parabola in Figure 6. Figure 6
Vertical Stretching and Shrinking • Multiplying the y-coordinates by c has the effect of vertically stretching or shrinking the graph by a factor of c.
Horizontal Stretching and Shrinking • Now we consider horizontal shrinking and stretching of graphs.If we know the graph of y = f(x), then how is the graph ofy = f(cx) related to it? The y-coordinate of y = f(cx)at x is the same as the y-coordinate of y = f(x) at cx.Thus, the x-coordinates in the graph of y = f(x) correspond to the x-coordinates in the graph of y = f(cx) multiplied by c.Looking at this the other way around, we see that thex-coordinates in the graph of y = f(cx) are the x-coordinatesin the graph of y = f(x) multiplied by 1/c.
Horizontal Stretching and Shrinking • In other words, to change the graph of y = f(x) to the graph of y = f(cx), we must shrink (or stretch) the graph horizontally by a factor of 1/c, as summarized in the following box.
Example 7 – Horizontal Stretching and Shrinking of Graphs • The graph of y = f(x) is shown in Figure 8. Sketch the graph of each function. • (a) y =f(2x) (b) y =f(x) Figure 8
Example 7 – Solution • Using the principles described in the preceding box, we obtain the graphs shown in Figures 9 and 10. y =f(2x) Figure 9 Figure 10
Even Functions • If a function f satisfies f(–x) = f(x) for every number x in its domain, then f is called an even function. For instance, the function f(x) = x2 is even because f(–x) = (–x)2 = (–1)2x2 = x2 = f(x)The graph of an even function is symmetric with respect to the y-axis (see Figure 11). Figure 11
Odd Functions • If f satisfies f(–x) = –f(x) for every number x in its domain, then f is called an odd function.For example, the function f(x) = x3 is odd becausef(–x) = (–x)3 = (–1)3x3 = –x3 = –f(x)
Example 8 – Even and Odd Functions • Determine whether the functions are even, odd, or neither even nor odd. • (a) f(x) = x5 + x(b) g(x) = 1 –x4(c) h(x) = 2x –x2 • Solution:(a) f(–x) = (–x5) + (–x) • = –x5– x
Example 8 – Solution cont’d • = –(x5 + x) • = –f(x) • Therefore, f is an odd function. • (b) g(–x) = 1 – (–x)4 • = 1– x4 • = g(x) • So g is even.
Example 8 – Solution cont’d • (c) h(–x) = 2(–x) – (–x)2 • = –2x – x2 • Since h(–x) h(x) and h(–x) –h(x), we conclude that his neither even nor odd.
Even and Odd Functions • The graphs of the functions in Example 8 are shown in Figure 13. • The graph of f is symmetric about the origin, and the graph of g is symmetric about the y-axis. The graph of h is not symmetric either about the y-axis or the origin. Figure 13(a) Figure 13(b) Figure 13(c)