Download
1 / 30
300 likes | 434 Vues
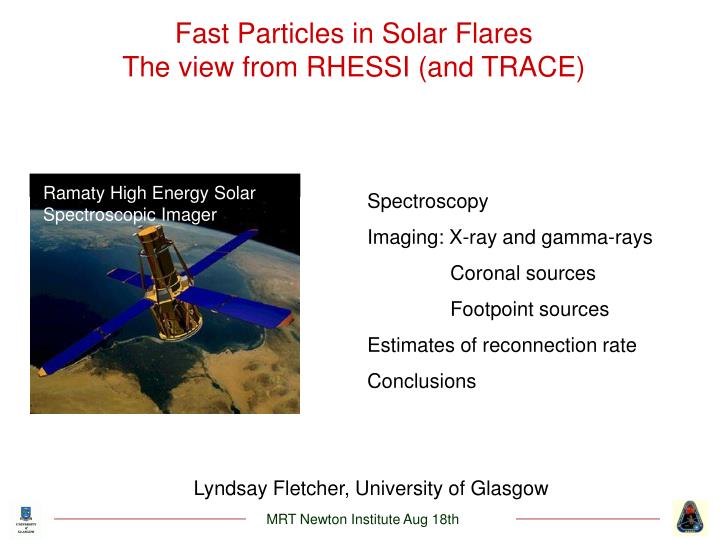
Ramaty High Energy Solar Spectroscopic Imager. MRT Newton Institute Aug 18th. Fast Particles in Solar Flares The view from RHESSI (and TRACE). Spectroscopy Imaging: X-ray and gamma-rays Coronal sources Footpoint sources Estimates of reconnection rate Conclusions.

E N D
Ramaty High Energy Solar Spectroscopic Imager MRT Newton Institute Aug 18th Fast Particles in Solar Flares The view from RHESSI (and TRACE) Spectroscopy Imaging: X-ray and gamma-rays Coronal sources Footpoint sources Estimates of reconnection rate Conclusions Lyndsay Fletcher, University of Glasgow
MRT Newton Institute Aug 18th Ge Detector High Resolution Spectrum 1keV bins at < 100keV Thermal bremsstrahlung 2.2 MeV line Non-thermal bremsstrahlung
MRT Newton Institute Aug 18th Movie: Eduard Kontar
Electrons from photons: forward fitting Photon spectrum I() is related to source-averaged electron spectrum: photons e.g. F(E) modelled with Maxwellian plus two power-laws Power-law electrons Holman et al 2003.
Electrons from photons: numerical inversion Photon spectrum I() is related to source-averaged electron spectrum by Write as discretised matrix equation Solve – eg as minimisation problem with smoothing Bars – inversion Full line – forward fitting Piana et al 2003
MRT Newton Institute Aug 18 2004 The devil in the details • Are features in the source spectrum real properties of the spectrum? • Or do they arise because of simplifications made in deducing them? • Typically, neither forward-fitting nor inversion takes account of: • non-uniform ionisation of chromosphere • photospheric hard X-ray albedo • electron-electron bremsstrahlung • Forward fitting (at present) further ignores the possibility of • multi-thermal plasmas
MRT Newton Institute Aug 18 2004 Effect of Albedo Inversion with correction for reflection of photons from photosphere can smooth out some of the interesting features (Kontar, Alexander and Brown 2004, in prep.)
Higher energy emission from higher in the looptop Strongly implies multi-thermal distribution MRT Newton Institute Aug 18 2004 Source position as a function of energy Figure: Amir Caspi, UCB
MRT Newton Institute Aug 18 2004 Comments on the electron energy budget/spectrum Total energy deposited by non-thermal electrons is ~ 2 .1024 J in a large (X) flare (assuming cold target, collisionally thick) We cannot uniquely determine the low-energy cutoff or turn-over in the power-law electron component. We can in most cases obtain an upper limit to the cutoff / turnover of typically 20 - 40 keV. Most spectra require a double power-law fit above the thermal component (but may disappear with further corrections to cross- section) The (minimum) total energy deposited by non-thermal electrons is comparable to the peak total energy in the thermal plasma
MRT Newton Institute Aug 18 2004 Electron number flux Max number flux = 2-5 1036 electrons s-1 Holman et al 2003 Coronal density ~ 109cm-3 So need to accelerate all the electrons in 1027 cm3 every second
MRT Newton Institute Aug 18 2004 July 23: electrons and ions Protons with 10s of MeV energy undergo spallation reactions on heavy ions, produce neutrons which are slowed down and undergo capture on H Neutron capture line at 2.223MeV 2.2 MeV centroid (i.e. protons) displaced from 50 keV centroid (i.e. electrons) by ~ 20” (~5 sigma result) No H, EUV, X-ray enhancement at 2.2 MeV centroid location (From Hurford et al. 2003)
MRT Newton Institute Aug 18 2004 October 28: electrons and protons • 2.2 MeV image (protons) • is integrated over 15 minutes • Electrons and protons • both close to ribbons • 2) possible small • difference of position: • < 15” ( ~104 km) • e and p are accelerated • in loops of similar size Image: courtesy Krucker & Hurford
MRT Newton Institute Aug 18 2004 October 28 Coronal Source Coronal sources can be well-fitted with thermal bremsstrahlung spectra. Temperatures up to ~ 40 MK First appear just before or ~ simultaneously with footpoints Often move during flare (limb events) Image: courtesy Krucker & Hurford
MRT Newton Institute Aug 18 2004 RHESSI CLEAN images at different energies: 3 Nov 2003 Image: Astrid Veronig
MRT Newton Institute Aug 18 2004 Evolution of RHESSI footpoints and looptop source Footpoints: 70-100 keV Loop top: 20-25 keV Time evolution: black white Image: Astrid Veronig
Ez - MRT Newton Institute Aug 18 2004 Inferring coronal reconnection rate Reconnection produces a coronal electric field – may directly accelerate particles Outside reconnection region: E + v B = 0 Measure of E given by rate of advection of B into reconnection region 2-D configuration The flare is clearly a 3-D configuration. However, we still expect high fluxes of fast particles at times of high reconnection rate
MRT Newton Institute Aug 18 2004 Flux, spectrum and ‘reconnection rate’ Rapidly reconfiguring magnetic fields should in principle provide a high energy input rate for acceleration of particles Movement of RHESSI source centroids (30-50keV) show chromospheric mappings of evolving coronal field High HXR flux/hard spectrum occur during intervals of rapid footpoint separation (Fletcher & Hudson 2002)
July 23, 2002 Courtesy: Säm Krucker
MRT Newton Institute Aug 18 2004 October 29: HXR flux and footpoint motion. Good correlation between particle flux and ‘reconnection rate’ in later phase of flare, when footpoint motion is ~ regular Images: Säm Krucker
MRT Newton Institute Aug 18 2004 July 17 2002 flare: TRACE observations
time MRT Newton Institute Aug 18 2004 ~130 separate tracks Fletcher, Pollock & Potts 2004
MRT Newton Institute Aug 18 2004 Flare footpoints on ~ simultaneous magnetogram
I1600 I1600 v BLOS v BLOS MRT Newton Institute Aug 18 2004 UV footpoint source intensity variations Typical examples: Peaks in v BLOS for individual footpoints show significant correlation in time with peaks in the UV brightness, during impulsive phase ObservationsMonte-Carlo simulations Peaks within 2s 25 5% 8 2% Peaks within 8s 45 5% 25 5%
MRT Newton Institute Aug 18 2004 Typical value of v BLOS ~ several 100 V m-1 v B ~103Vm-1 v B ~1.5x10³Vm-1 Hard X-ray footpoints occur where v BLOS ~ 1 kV m-1
N P1 P2 Pairs of correlated footpoints pairs of footpoints for which UV time profiles highly correlated (lines join pairs with linear correlation coefficient > 0.8)
MRT Newton Institute Aug 18 2004 Potential field extrapolation (zero free energy) P1 N P2
MRT Newton Institute Aug 18 2004 Conclusions • RHESSI spectroscopy gives new insights into source-averaged electron distributions • There is still more to be explored in the details: e.g. non-isothermality, • We need full imaging spectroscopy (particularly of coronal sources) to get closer to acceleration/heating mechanism • Understanding displacements between signatures of electrons and protons will require better understanding of the magnetic structure (as well as the acceleration mechanisms) • There are suggestions of a good correlation between accelerated electron flux, and a measure of the instantaneous reconnection rate