Download
1 / 23
260 likes | 732 Vues
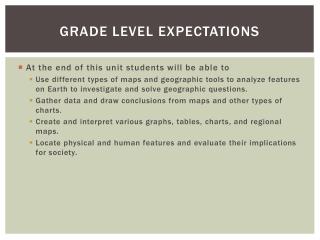
How are different types of maps distinguished?. Political Maps. Usually colored by country or by state Political colors make it easy to compare size, shape, and location Bold letters often make the country names stand out Symbols make it easy to tell capitals from other cities

E N D
Political Maps • Usually colored by country or by state • Political colors make it easy to compare size, shape, and location • Bold letters often make the country names stand out • Symbols make it easy to tell capitals from other cities • Political maps also name certain physical features, such as rivers and lakes
Physical Map • Has colors that make natural patterns stand out • The colors on the map can stand for types of vegetation, mountain, and natural features • Names of big natural features are easy to see • Physical maps also include some political information, such as boundaries
Climate Map • The climate of a place is the weather it has season by season, year after year • Rainfall and temperature are climate’s main ingredients • Climate is affected by elevation, distance from the ocean, and latitude
Land Use Resource Map These maps show how land is being used. This might refer to: • vegetation • crops being grown • forest vs. Agriculture • mines and wells • city zoning.
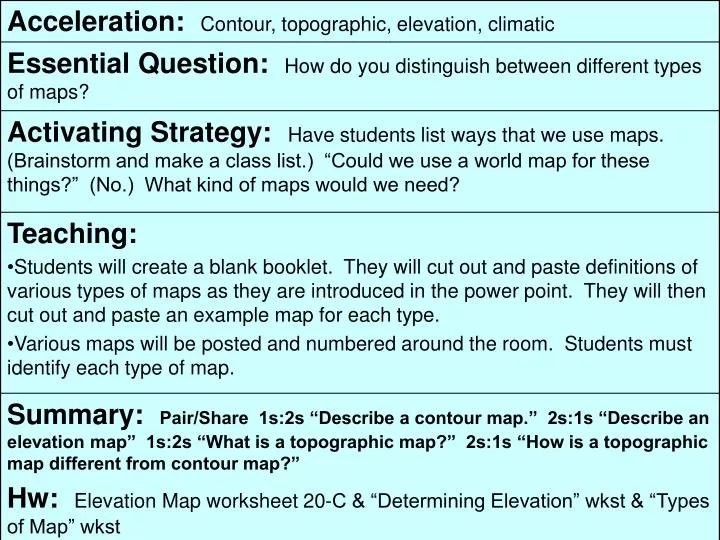
Contour maps Contour lines represent the elevation at that line. If you were to walk across a line, you are changing elevation.
Elevation Maps Maps that show elevation change by using color or shading.
What is the average elevation of most of our state? Elevation Map
Topographic Map These maps generally represent a small area with a lot of detail. They show elevation with contour lines, natural and man-made features.
Types of Maps • This map represents a small area with lots of detail. It has contour lines as well as natural and man-made features. _______________ • This map uses colors to show height above sea level. ____________________________ • These colorful maps show lines that people use to divide countries and states. They also show major cities. _____________________ • These maps show physical features on the Earth like rivers, mountains, and deserts. ____________________________ • These maps show how land is being used. For example, they might show which crops are being grown or what animals are being raised. __________________________ • These maps show climate regions. ___________________