Download
1 / 11
110 likes | 212 Vues
Quantification of Ventilation Activity in V/Q Scanning. Michelle Lax Lincoln County Hospital. Background. We wanted to accurately determine the ventilation activity inhaled for a VQ scan. WHY? for accurate reporting of administered activity to check we aren’t exceeding ARSAC limits

E N D
Quantification of Ventilation Activity in V/Q Scanning Michelle Lax Lincoln County Hospital
Background • We wanted to accurately determine the ventilation activity inhaled for a VQ scan. • WHY? • for accurate reporting of administered activity • to check we aren’t exceeding ARSAC limits • to determine when to delay perfusion scan
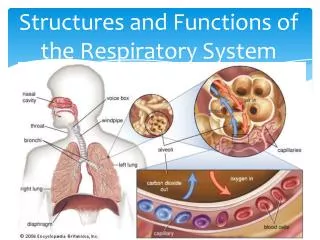
Estimation of Ventilation Activity • Technigas is inhaled for vent part of V/Q scan • ARSAC limit = 40MBq (eff. dose = 0.6mSv). • GM tube to monitor patient up to 100cps • 10sec posterior ventilation image • HR sensitivity = 70cps/MBq • GP sensitivity = 120cps/MBq • Round down to 50 and 100 cps/MBq • to account for patient attenuation • therefore estimating higher activity
Example 10sec vent posterior image = 12 kcnts (1200cps) GP approx. sensitivity = 100cps/MBq Estimated Activity = 12 MBq
Example 10sec vent posterior image = 8 kcnts (800cps) HR approx. sensitivity = 50cps/MBq Estimated Activity = 16MBq Estimated value used to determine whether the perfusion scan can commence straight away Rule of thumb: perf cnts (100MBq) should be 3 - 5 times vent cnts
BUT…... 1. We need to account for attenuation differences between anterior and posterior need to use geometric mean 2. We need to calculate patient specific sensitivity
Theory of Vent Activity Program • Protocol_tool • Query: counts, duration, date, time of ventilation and perfusion ant and post images NB: ACQTIME in seconds from 00:00hrs • Convert to counts per second • Calc geometric mean of vent and perf cnts • Ventgeometric mean = (Ventant x Ventpost) • (Perf&Vent)geometric mean = (Perfant x Perfpost)
Theory of Vent Activity Program • Decay correct Ventgeo to time of Perf scan (ask operator: Were both completed? Were they on the same day? Which was first?) • (Perf&Vent)geo-Ventdecay corr= Perfonly • Calculate camera sensitivity for this patient (ask operator for perf activity, including residual activity) • Sensitivity (cps/MBq) = Perfonlycnts / Perf Act • Vent Act = Vent cnts / Sensitivity
Analysis of Ventilation Activity • No significant difference in vent activity between using posterior counts or geometric mean (p=0.8) • A significant difference in vent activity between using camera or patient sensitivity (p<0.001) • Comparing vent activity calculated from program to estimated vent activity: • % Activity Increase = 39.3 14.2 % • Smallest Error: 9 12.75 MBq (+3.75 MBq) • Largest Error: 24 45.65 MBq (+21.65 MBq) (Mean Activity Increase = 10 MBq)
Conclusions • A simple program has been written to calculate accurate ventilation activities. • Found we had been underestimating ventilation activity. • Changed action level for delaying Perfusion scan to when estimated ventilation activity (from 10sec posterior counts) = 25MBq.


![Respiratory Physiology [the Ins and Outs]](https://cdn2.slideserve.com/4330665/respiratory-physiology-the-ins-and-outs-dt.jpg)