Download
1 / 40
1.34k likes | 3.33k Vues
System development methodologies. Structured design Waterfall development Parallel development Rapid Application development Phased development Prototyping Throwaway prototyping Agile Development Extreme Programming (XP). PLANNING. ANALYSIS. DESIGN. IMPLEMENTATION. SYSTEM.

E N D
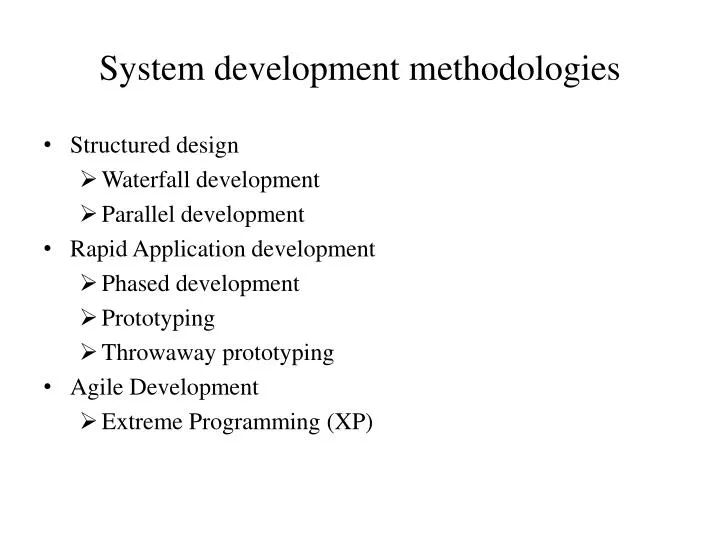
System development methodologies • Structured design • Waterfall development • Parallel development • Rapid Application development • Phased development • Prototyping • Throwaway prototyping • Agile Development • Extreme Programming (XP)
PLANNING ANALYSIS DESIGN IMPLEMENTATION SYSTEM Waterfall Development
Waterfall Development Advantages: System requirements identified long before programming begins Large degree of management control promotes documentation and ensures ability to trace user requirements thus minimizing changes to requirements Disadvantages: Design must be completely specified on paper before programming begins Use of paper specifications can result in misunderstanding of user requirements Complex and lengthy – large amount of time elapses between analysis and delivery of the system – user needs may change
PLANNING ANALYSIS SUBDESIGN OVERALL DESIGN SUBDESIGN SUBIMPLEMENT SUBDESIGN SUBIMPLEMENT SUBIMPLEMENT OVERALL IMPLEMENTATION SYSTEM Parallel Development
Parallel Development Advantages Same as for waterfall development plus: Time is reduced compared to the waterfall method which decreases the chances that user needs will change before the system is implemented Disadvantages Same as for waterfall plus: Subsystems are not usually independent so changes in one subsystem can affect others Additional work to coordinate and integrate subsystems
PLANNING V1 ANALYSIS OVERALL ANALYSIS V1 DESIGN V1 IMPLEMENT V2 ANALYSIS V2 DESIGN SYSTEM VERSION 1 V2 IMPLEMENT V3 ANALYSIS V3 DESIGN SYSTEM VERSION 2 V3 IMPLEMENT SYSTEM VERSION 3 Phased Development
Phased Development Advantages Quickly gets a useful version into the hands of the users System provides business value sooner compared to structured methodologies Users able to provide feedback and discover important new requirements sooner Disadvantages User begins to work on a system that is intentionally incomplete Problems with success and acceptance of the system can occur if the essential features are not identified for the first version. Must manage user expectations in terms of having to wait for features that will be implemented in subsequent versions
PLANNING ANALYSIS DESIGN SYSTEM PROTOTYPE IMPLEMENTATION IMPLEMENTATION SYSTEM Prototyping
Prototyping Advantages Provides users with a system to interact with very quickly Reassures users that the project is indeed progressing towards a finished system Helps to refine requirements more quickly – users can interact with the prototype and better understand what it can and cannot do easier than if the system were on paper. Disadvantages Fast pace makes it more difficult to conduct a thorough analysis Initial prototype could lead you down an ineffective path and once started, it is difficult to go back to the beginning
ANALYSIS PLANNING DESIGN IMPLEMENTATION ANALYSIS DESIGN PROTOTYPE DESIGN IMPLEMENTATION SYSTEM Throwaway Prototyping
Throwaway Prototyping Advantages Combines complete analysis and design with advantages of prototyping to refine key issues before that system is built Tends to produce more stable and reliable systems than prototyping. Disadvantages Slower than prototyping since the design prototypes are thrown away and do not become part of the final system
Extreme Programming (XP) • A team of users and developers document “user stories” • Users describe user acceptance tests which will demonstrate that the system provides the required functionality once it is completed • Developers then plan a series of releases – no release to take more than a couple of months to complete • General principles: • Superficial planning process • Continuous, automated testing (every day) • Continuous integration • Heavy user involvement • Pair programming • Specific attention to human interactions and limitations
Extreme Programming PLANNING ANALYSIS SYSTEM DESIGN IMPLEMENTATION
Extreme Programming Advantages Fast delivery of results Works well in projects with undefined or changing requirements Disadvantages Requires discipline Works best in small projects Requires much user input
Selecting a Methodology Depends on: • Clarity of user requirements • Familiarity with technology • System complexity • System reliability requirements • Time available • Visibility of risk factors
Selecting a Methodology Agile Methods Structured Methodologies RAD Methodologies Ability to Develop Systems Waterfall Parallel Phased Prototyping Throwaway XP With unclear user requirements Poor Poor Good Excellent Excellent Excellent With unfamiliar technologies Poor Poor Good Poor Excellent Poor That are complex Good Good Good Poor Excellent Poor That are reliable Good Good Good Poor Excellent Good With a short time schedule Poor Good Excellent Excellent Good Excellent With schedule visibility Poor Poor Excellent Excellent Good Good
Selecting a Methodology • Use a little ‘common sense’ • What is critical? • Enron • Arthur Andersen & Co., LLP • WorldCom • Nortel
Selecting a Methodology • Requirements Clarity • Technology Familiarity • System Complexity • Reliability Concerns • Time Schedules • Schedule Visibility (Murphy’s Law)
Project Management • A ‘hot’ skill • Project Management Tasks: • identifying project size • create and manage work plan • staff the project • control and direct the project
Managing a Info. Sys. Project Four Phases: • Initiating • Planning • Executing • Closing
Three Attributes of an IT Project • System Quality and Functionality • Development Speed • Development Cost The contemporary thinking is that the Project Sponsor gets to pick two, the Project Manager controls the third
Some typical causes of project failure • Not enough commitment from senior management • Not enough commitment to following an appropriate system development methodology - taking shortcuts • Not managing expectations well enough • scope creep • feature creep
More causes of project failure • Poor estimating techniques • Over optimism • Mythical man-month • Inadequate people management skills • A weak or problematic project team • Insufficient or inappropriate resources • Failure to adapt to business change • Failure to stick with the plan • Failure to monitor the plan
Creating a Work Plan • Identify Tasks • Estimate Completion Times • Create Deliverable Timetable • Suggest Milestones
Project Parameters • From clear objectives, identify high level tasks • Milestones MUST be identified in advance • Recognize that historical time estimates have been poor (222%)
Negotiating scope • Scope: • Defined in terms of features (size), quality, time, cost, and resources • Also defined in terms of processes, data and stakeholders • Deliverable – a statement of work • May be much more than a section of the system proposal, particularly if it forms the basis for a contract with a consultant
Statement of Work I. Purpose II. Background A. Problem, opportunity, or directive statement B. History leading to project request C. Project goal and objectives D. Product description III. Scope A. Stakeholders B. Data C. Processes D. Locations IV. Project Approach A. Route B. Deliverables V. Managerial Approach A. Team building considerations B. Manager and experience C. Training requirements (continued)
Statement of Work (concluded) V. Managerial Approach (continued) D. Meeting schedules E. Reporting methods and frequency F. Conflict management G. Scope management VI. Constraints A. Start date B. Deadlines C. Budget D. Technology VII. Ballpark Estimates A. Schedule B. Budget VIII. Conditions of Satisfaction A. Success criteria B. Assumptions C. Risks IX. Appendices
Estimating Project Size • Expert Opinion goes a long way • Consultants tend to have a proprietary application for this • a significant expertise to bring to a project • Can use historical data (if it exists) • Algorithmic Models Exist (COCOMO)
Estimating Project Size • An example: IBM’s Function Point Approach • Calculate inputs, outputs, queries, files and interfaces • determine complexity of each, and factor it to determine overall project size • convert to lines of code (based on a standard)
Estimating Time and Effort • Effort: convert from lines of code to person-months (i.e. COCOMO estimates) • Time: schedule time converted from person-months
A Notable Technique: ‘Timeboxing’ • Develop a ‘hard’ end date • System delivered on time in whatever state can be achieved • Popular with software production • Something is delivered in the ‘timebox’
Executing the Project • executing the baseline plan by: • selecting/training/managing the people on the project • getting resources • e.g. space, computers • monitoring progress and adjusting the plan • manage changes to the statement of work • maintain project workbook • communicate the project status
Techniques: Representing and Scheduling Projects • Several Methods • pen and paper • GANTT chart • PERT charts: arrows and nodes, critical path • in all cases • determine tasks • determine times • determine sequence
Gantt Chart • Graphical representation of project showing each task activity as a horizontal bar • length of horizontal bar represents time to completion • visual display of the duration of activities in the project • estimated and actual times can be displayed • most useful for small projects or sub projects (due to number of activities)
Gantt Chart showing Progress on Activities versus Planned Durations
PERT Chart • PERT (Program Evaluation and Review) • graphic representation of task activities and their inter-relationship • the ordering of the activities is shown by connecting activities with arrows • the arrows indicate the sequence of activities • two arrows emerging from one activity indicate the new activities can be accomplished in parallel ( at the same time)
Useful risk reduction practices • Prepare 3 estimates – worst, best and estimated, and compare to actuals • Use standard notations and methodologies • Use CASE and other automated project management and control tools • Practice iterative development and “time boxing” • Use a formal change-request process • Create “Centers of Excellence” or specific expertise • Re-use components • Define and use metrics • Institute version control