Download
1 / 48
490 likes | 600 Vues
ITIL and SLM – The Buried Treasure to Customer Satisfaction for The Convergence Technology Council. Peggy Gerace-Roosa Director, Operations Communication and Reporting May 18, 2006. About EarthLink.

E N D
ITIL and SLM – The Buried Treasure to Customer Satisfaction for The Convergence Technology Council Peggy Gerace-Roosa Director, Operations Communication and Reporting May 18, 2006
About EarthLink • 10-year-old company after successful merger of equals in 2001 between EarthLink and MindSpring • Annual Revenue: $1,400,000,000.00 ($1.4B) • Number of Employees: ~2,000 • Number of Customers: 5.4 million (as of Dec. 2004) • Subscriber Growth Attributed to: • Acquisitions • Channel sales • Reseller partnerships • Organic (walk-ins)
Broadband Coverage ~200 Markets with Broadband Offerings Large and Diverse Infrastructure ~2300 Network Elements ~1600 Server Elements Thousands of Access Circuits, Hundreds of WAN Circuits • 5.4M Customers • ~4M Dialup (Premium ~3.5M, Value ~500K) • ~1.2M Broadband (Cable, xDSL) • ~160K Web Hosting (Unix, Windows) • ~50K Wireless (Blackberry, PDA, Laptops, Wi-Fi) • Dial Access Coverage > 90% of US Population • ~16K Local Dial Access Numbers • ~500K Active Modem Ports (~50% ELNK, ~50% Outsourced) • ~250 PoPs (18 Core Backbone PoPs, four data centers)
Goals for Tonight • Brief Introduction to ITIL • More info on the areas implemented • SLM and Incident Management as Cornerstone to ITIL Implementation Efforts • Environment: Before and After • Major Changes • Benefits • Wet Your Appetite for MORE…
First Goal Brief Introduction to ITIL
We’re the Folks Who Stop the Plane from Moving! Break through walls- Establish processes to achieve quality- Establish and report on quality metrics
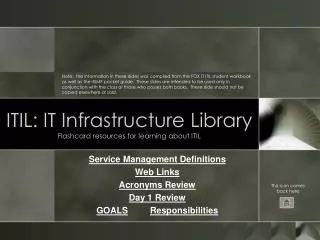
What Is ITIL®? • Information Technology Infrastructure Library • Comprehensive library of best practices for planning, deploying, and supporting IT services • De-facto global standard in Service Management • ITIL® describes the WHAT, not the HOW of implementing service management • A well-known, proven framework that will accommodate the addition of more processes as they became ready 8
Service Support vs. Service Delivery Total of 12 ITIL Process Areas, broken into 2 distinct categories Service Delivery • Service Level Management* • Capacity Management • Service Continuity Management* (related to Disaster Recovery) • Availability Management • Financial Management
Service Support vs. Service Delivery Service Support • Configuration Management • Incident Management* • Problem Management • Service/Help Desk • Security Management* • Change Management* • Release Management*
Change Management • To manage the process for requesting, assessing, authorizing and implementing changes to the Earthlink production environment • To ensure that no unauthorized changes are implemented • To minimize the risks involved with new product and service releases • To minimize disruption caused by changes • To ensure that changes are properly researched and that all relevant parties have input into the assessment of changes • To coordinate the effort involved in building, testing and implementing changes 13
Release Management • Minimize unplanned downtime through high-quality products and services • Minimize planned downtime by improving the reliability, availability, and maintainability of products and services • Use metrics to track and diagnose issues, creating a mindset of continuous improvement • Avoid “Re-work” by implementing end-to-end processes that minimize the production cycle and improve costs 15
Service Level Management • Work with internal and external customers to established agreed upon service levels • Provide reporting to monitor success • Maintain and improve IT Service quality • Constant cycle of monitoring and reporting upon IT Service achievements • Oversee actions to eradicate poor service – in line with business or cost justification • Achieve a better working relationship between Operations and core business units • Establishing clear and regular communication on service quality
Incident Management • Establish processes and procedures to restore normal service operation as quickly as possible and minimise the adverse impact on business operations • Establish clear and documented escalation procedures and tools which will allow for reliable management of service events giving priority to the most critical issues • Establish procedures to ensure service events are escalated within the agreed upon SLAs, have established accountability, and problem ownership
Second Goal SLM and Incident Management as Cornerstone to ITIL Implementation Efforts • Environment: Before and After • Major Changes • Benefits
Background: ELNK Operations Operations Net Eng Network Planning Network Design Line Capacity MIS/CIO Financial Systems Billing Invoicing Fulfillment Internal Tools Solution Center System Admin External Customer Facing Systems System Capacity Planning CTO Office Architecture Technology Standards Product Dev New Products Existing Products Corporate Project Mgmt Network & Data Center Ops NOC Data Center Mgmt Production Security Fraud & Abuse SLM & Process Mgmt QE Quality Control
Rational for SLM and PIP Efforts Operations Environment Before SLM • Supported both internal-facing and customer-facing systems • 57 independent departments handled varying degrees of break/fix issues • Close to 100 ticketing systems • Two escalation points: NOC and Solutions Center
Instant Messaging Monitoring Systems Personal Relationships Web Remedy Email Before SLM:Support Channels and Resolution Paths Multiple Support Channels Phone Calls Walkups Individual Developers Product Teams 3rd Party Vendors Solutions Center NOC Multiple Resolution Paths
After SLM: Support Channels and Resolution Paths Fewer Support Channels Customer calls 21111 Monitoring Systems Email Web Remedy Solutions Center NOC Streamlined Resolution Paths
Personal Relationships Product Teams 3rd Party Vendors Solutions Center NOC Before SLM:Break/Fix Resolution Paths Individual Developers
After SLM:Break/Fix Resolution Path Tier 1 Solutions Center NOC Tier 1 resolves SE or escalates it to T2 - updates Remedy Tier 2 Escalation Sends Alert Tier 2 receives alert on wireless device and accepts the SE Tier 2 resolves SE or escalates it to T3 and updates Remedy Tier 3 Escalation Sends Alert Tier 3 resolves SE and updates Remedy Tier 3 receives alert on wireless device and accepts the SE
So…What Changed? • Remedy Revamped • Improved Web Remedy stability • Redesigned interface • Updated online help • Processes Reworked • New severity codes • Formal tier structure • Pager usage • On-call scheduling
Major Changes: Severity Codes Each Severity has Responsiveness Rules • Dictates responsiveness to customer • Ex: Respond within 15 min. for S1 service event Each Severity has Escalation Rules • Primary, Secondary, Tertiary Each Severity has Notification Rules • Ensures executives, management, technicians, and customers are consistently notified at appropriate times Each Severity has Resolution Rules • Ex: Resolve S1 service events within 90 minutes (fixed) Each Severity has an associated Service Clock • Ex: S1 Service Clock runs 24 x 7
Major Changes: Tiers Tier 1 • NOC, Abuse, and Solutions Center staff who receive customer requests for service, information, or problem resolution Tier 2 • EarthLink Operations staff with a higher level of technical or functional expertise in specific areas • They provide information or solutions that Tier 1 is unable to provide Tier 3 • EarthLink Operations staff with the highest level of technical or functional expertise in specific areas • They provide information or solutions that Tier 2 is unable to provide • The final service event resolution owners
Major Changes: RIM Pager Usage • RIM (bi-directional email devices) are required for Tier 2 and Tier 3 technicians, managers and sr. managers responsible for break/fix • Personnel required to add their pager information into Remedy • Initial pager purchase and setup costs paid from Operations account set up specifically for SLM
Major Changes: On-Call Support Matrix • Automated service event assignment to on-call support staff • Managers receive weekly Monday email identifying who they’ve listed on call for the coming week • On-call schedule updated as needed • No more searching for who’s on call!
Major Changes: SLM Reporting Establishing key performance measurements for service metric reporting compliance, including: • Response rate by severity code(goal is to meet 80%) • Resolution rate by severity code (goal is to meet 80%) • Call handle rate (abandon rate) • Average call answer time • Email response rate • First contact resolution (FCR) rate • % Root Problem/Identification/Elimination • Customer Satisfaction • Surveys • Reopened Service Events
Major Changes: Reporting and Metrics Departmental/Divisional Reports & Dashboards Remedy System Trending & Process Variance Reporting Operations-wide Review Individual Employee Review Root Cause Analysis
Benefits • Accurate and consistent metrics measuring the impact of changes to the production environment has resulted in continuous and sustained process improvement • Note of caution: What you don’t measure is as important as what you do measure. Both drive behavior • The culture at EarthLink is slowly changing to one of service orientation from IT versus everyone else • Process improvement ha been a valuable tool to help in breaking down silos and networks of “this is how we’ve always done it” • Ability to spot and analyze trends over time • Build business cases for process, tool, and staffing modifications • Eventually reduces time required to remediate break/fix issues
Final Goal Wet Your Appetite for MORE!
Operations Baseline Total Service Events for Baseline: 47,817 or avg. ~15,939/ month Reduced by 15% in first 2 years
Average Response and Resolution Ops: Response: 79% Resolution: 70%
For More Information… • itSMF (IT Service Management Forum) http://www.itsmf.com/ • Pink Elephant http://www.pinkelephant.com/en-US/ • LaBounty and Associates http://www.labountyassociates.com/ • Help Desk Institute http://www.helpdeskinst.com/ • Gartner http://www.gartner.com/
Questions? Peggy Gerace-Roosa Director of Operations Communication and Reporting geraceme@corp.earthlink.net O: 626-296-5769 C: 626-676-3670 http://home.earthlink.net/~pgerace/