Download
1 / 11
110 likes | 339 Vues
Microarray Analysis of Drosophila Development During Metamorphosis. K. P. White, S. A. Rifkin P. Hurban and D. S. Hogness. Goal. Use of DNA microarrays to study changes in gene expression patterns during Drosophila metamorphosis, induced by ecdysone peaks.

E N D
Microarray Analysis of Drosophila Development During Metamorphosis K. P. White, S. A. Rifkin P. Hurban and D. S. Hogness
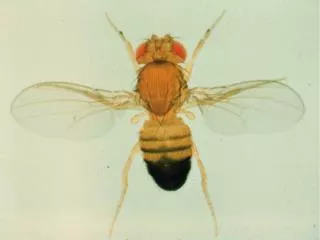
Goal • Use of DNA microarrays to study changes in gene expression patterns during Drosophila metamorphosis, induced by ecdysone peaks. • Studies were performed during six time points relative to the puparium formation (PF) stages that span two ecdysone pulses.
Drosophila metamorphosis : material The arrays • Array elements : 6'240 cDNA clones from the Berkeley Drosophila Genome Project, covering about 40% of the total estimated number of genes in Drosophila, plus known ecdysone-regulated control genes • Interesting subset : 534 elements displaying threefold or more differential expression during metamorphosis • Number of experiments : 19, covering 6 time points relative to PF
Drosophila metamorphosis : material The samples • Reference sample Cy3-labelled : Animals in puparium formation (PF) stage, 0 hour • Time-course experiments, Cy5-labelled :18 and 4 hours before PF , and 3, 6, 9, 12 hours after PF
Drosophila metamorphosis : methods • Two methods were used to interpret the data : • 1- The Stanford clustering method. • 2- A self-organizing map (SOM) algorithm. • This method allows the user to choose the • number of desired clusters. The result is displayed in graphs which represent the clusters. Time points are represented in these graphs from left to right.
Drosophila metamorphosis : results Stanford clustering Differentially expressed genes fall into two main categories. The first category contains genes that are expressed at 18 hours BFP (before the late larval ecdysone pulse) but then fall to low or undetectable levels during this pulse. This category is colored red in the first column. They are potentially repressed by ecdysone The second category consists of genes expressed at low or undetectable levels before the late larval ecdysone pulse but then are induced during this pulse. They are potentially induced by ecdysone.
Drosophila metamorphosis : results SOM clustering The label in the upper left corner of each cluster indicates the cluster number. The number in the top center of each box indicates how many elements (out= of 534) are in each cluster. Yellow boxes show the clusters containing the control genes (Known ecdysone-controlled genes) Blue lines are the mean expression profiles; Red lines indicate SD.
Drosophila metamorphosis : results More detailed results Genes encoding structural and regulatory elements of muscle formation and other muscle specific proteins are down-regulated at 4 Hr BPF. This prepares the larval muscle breakdown which begins aproximately 2 hours APF
Drosophila metamorphosis : results More detailed results The CNS undergoes dramatic differentiation during early metamorphosis. The genes involved in this differenciation are induced at the stage 4 hours BPF, probably by the first ecdysone peak
Drosophila metamorphosis : results More detailed results Genes involved in programmed cell-death, as reaper, caspase-1 are induced by the fisrt ecdysone peak, whereas genes encoding cell death inhibitors are induced by the second peak. DHR3 is a repressor of ecdysone-inductible genes, but can induce genes active during midprepupal development (BFTZ-F1, LD24139)
Drosophila metamorphosis : results More detailed results Genes encoding enzymes in the glycolytic pathway are down-regulated, suggesting that some cells temper their metabolic activity during metamorphosis. The figure shows the Glycolytic pathway. Enzymes with their gene present on the array are listed in red. The fold repression during the first time-course experiment is shown by numbers in red.