Download
1 / 5
50 likes | 140 Vues
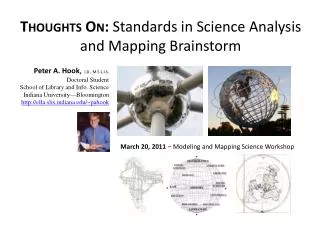
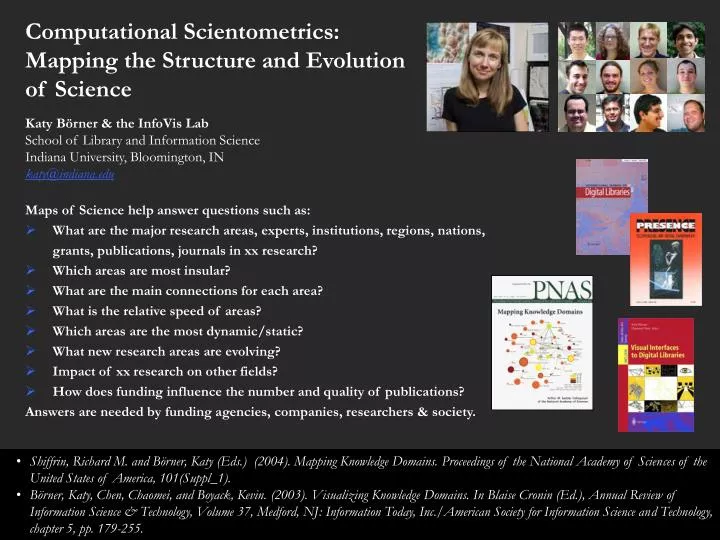
Computational Scientometrics: Mapping the Structure and Evolution of Science Katy Börner & the InfoVis Lab School of Library and Information Science Indiana University, Bloomington, IN katy@indiana.edu Maps of Science help answer questions such as:

E N D
Computational Scientometrics: • Mapping the Structure and Evolution • of Science • Katy Börner & the InfoVis Lab • School of Library and Information Science • Indiana University, Bloomington, IN • katy@indiana.edu • Maps of Science help answer questions such as: • What are the major research areas, experts, institutions, regions, nations, • grants, publications, journals in xx research? • Which areas are most insular? • What are the main connections for each area? • What is the relative speed of areas? • Which areas are the most dynamic/static? • What new research areas are evolving? • Impact of xx research on other fields? • How does funding influence the number and quality of publications? • Answers are needed by funding agencies, companies, researchers & society. • Shiffrin, Richard M. and Börner, Katy (Eds.) (2004). Mapping Knowledge Domains. Proceedings of the National Academy of Sciences of the United States of America, 101(Suppl_1). • Börner, Katy, Chen, Chaomei, and Boyack, Kevin. (2003). Visualizing Knowledge Domains. In Blaise Cronin (Ed.), Annual Review of Information Science & Technology, Volume 37, Medford, NJ: Information Today, Inc./American Society for Information Science and Technology, chapter 5, pp. 179-255.
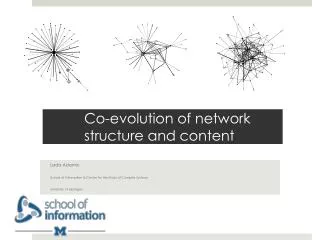
Mapping the Evolution of Co-Authorship Networks (Ke, Visvanath & Börner, 2005) Mapping Medline Papers, Genes, and Proteins Related to Melanoma Research (Boyack, Mane & Börner, 2004) Mapping the Evolution of Co-Authorship Networks (Ke, Visvanath & Börner, 2004) Spatio-Temporal Information Production and Consumption of Major U.S. Research Institutions (Börner & Penumarthy, 2005)
Studying the Emerging Global Brain: Analyzing and Visualizing the Impact of Co-Authorship Teams (Börner, Dall’Asta, Ke & Vespignani, 2005) Mapping Indiana’s Intellectual Space Science Maps for Kids
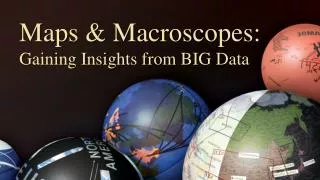
Places & Spaces: Cartography of the Physical and the Abstract The first iteration of this science exhibit compares and contrasts first maps of our entire planet with the first maps of all of sciences. http://vw.indiana.edu/places&spaces/
CAREER: Visualizing Knowledge Domains. NSF IIS-0238261 award (Katy Börner, $440,000) Sept. 03-Aug. 08. SEI: NetWorkBench: A Large-Scale Network Analysis, Modeling and Visualization Toolkit for Biomedical, Social Science and Physics Research. NSF IIS-0513650 award (Katy Börner, Albert-Laszlo Barabasi, Santiago Schnell, Alessandro Vespignani & Stanley Wasserman, Craig Stewart (Senior Personnel), $1,120,926) Sept. 05 - Aug. 08.