Download
1 / 22
240 likes | 430 Vues
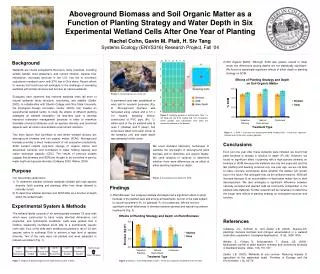
Spatial Mapping of Forest Aboveground Biomass (ABG) using Remote Sensed Data. Bob Pliszka, VP- Operations & Forestry, ImageTree Corporation Advisor - Dr. Wayne Myers, Professor of Forest Biometrics; Director, Office for Remote Sensing and Spatial Information Services September 23 rd , 2008.

E N D
Spatial Mapping of Forest Aboveground Biomass (ABG) using Remote Sensed Data Bob Pliszka, VP- Operations & Forestry, ImageTree Corporation Advisor- Dr. Wayne Myers, Professor of Forest Biometrics; Director, Office for Remote Sensing and Spatial Information Services September 23rd, 2008
Geographic Focus Hardwood forests of East Rockhill township, Bucks County, Pennsylvania
Background • Significant increase during the last ~15 years in Greenhouse Gas Emissions (GHG) in the US (and globally) From Environmental Protection Agency website. http://www.epa.gov/climatechange/emissions/downloads/08_Trends.pdf
Background • Currently there’s an ongoing global effort to reduce GHG levels • In the US, voluntary trading of forest carbon credits • Carbon emitters can purchase “credits” • US working towards a mandatory cap and trade system • Will require an effective means for measuring and mapping biomass levels
Background • Net increase in biomass from year to year is used to calculate CO₂ available for trading • One such example is the Chicago Climate Exchange (CCX) • Global system, the Kyoto Protocol, only recognizes afforestation credits • One area of focus is the mapping of forest aboveground biomass (ABG) • ABG provides an input into calculations of CO₂ • ABG provides insight into GHG emission levels
Mapping ABG • Traditional ground based forest inventory methods (Brown et al) • Translates directly into forest biomass • (Photo taken from the Food and Agricultural Organization of the United Nations Website) http://www.fao.org/
Mapping ABG • High resolution imagery (Neilson et al) • Low resolution imagery (Hall et al) • (LiDAR) (Bortolot and Wynne, Van Aardt et al, Patenaude et al)
Mapping ABG • Combination of traditional ground methods and remote sensed data (Brown et al) + = ABG
Mapping ABG • Current commercial ABG solutions are: • Can be less cost effective for small woodlots • Potential lack of incentive for small, non-industrial private owners • Coarse resolution and targeted for large scale; not always optimal for small ownerships • High resolution remote sensed data may help…. • Readily available and current in certain cases • Provides reliable spatial information
Objective • Spatially map forest biomass in East Rockhill township, Bucks County, Pennsylvania • Use of both: • Low resolution Landsat imagery (20-30 meter pixel) • High resolution NAIP imagery (1 meter pixel) • Compare and contrast the estimated biomass maps from the two datasets
Materials • Forestry tools • Diameter tape • Clinometer • 10 BAF prism • Misc. • Applicable biomass equations • USDA FIA Data • Arcview GIS software • Remote Sensed Data • Landsat data (30 meter pixels) • National Agricultural Imagery Program (NAIP) imagery (1 meter pixel) • Shapefiles and coverages: • East Rockhill township boundaries • Hydrology layers
Methods • Digitization of forest stand boundaries (homogenous areas) • Classification (forest vs. non-forest, mature vs. young, etc.)
Methods • Collection of low intensity tree measurement data
Methods • For every forested stand • Estimation of tree volume and biomass (per stand basis) for both remote sensed data sets • Quantification of differences • Forested acres • Total estimated biomass • Spatial distribution of biomass • Creation of Thematic Maps and final write up
Anticipated Results • Relative ABG maps for East Rockhill township • Analysis and visualization of estimated ABG differences using high vs. low resolution remote sensed data • Potentially lead to further efforts to develop efficient and cost effective methods for small private woodlot owners
Thank You! Bob Pliszka Sellersville, PA 215-258-2855 rgp108@psu.edu